Unlock a world of possibilities! Login now and discover the exclusive benefits awaiting you.
- Qlik Community
- :
- All Forums
- :
- QlikView App Dev
- :
- Gauge Chart not showing correct value
- Subscribe to RSS Feed
- Mark Topic as New
- Mark Topic as Read
- Float this Topic for Current User
- Bookmark
- Subscribe
- Mute
- Printer Friendly Page
- Mark as New
- Bookmark
- Subscribe
- Mute
- Subscribe to RSS Feed
- Permalink
- Report Inappropriate Content
Gauge Chart not showing correct value
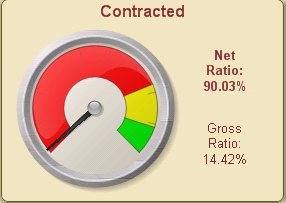
I have a gauge chart (speedometer) that does not show the correct value for its expression. If I take the expression calculation and use it in just about any other type of object it produces the correct value (listbox, text object...ect). So, I definitely know the expression produces the correct value 0-100%...for instance the expression returns .900336 in the Net Ratio object, the dial gauge shows 1.51% for the exact same expression. I have several gauges that all of a sudden started doing this, never was an issue before - only thing that changed was the amount of data (increased) over time. Anyone have an idea what could be going on?
thanks
ron
- Mark as New
- Bookmark
- Subscribe
- Mute
- Subscribe to RSS Feed
- Permalink
- Report Inappropriate Content
It's hard to say without seeing the file, however I'd check your the min and max values in the properties and any settings relating to the segment bounds.