Unlock a world of possibilities! Login now and discover the exclusive benefits awaiting you.
- Qlik Community
- :
- All Forums
- :
- QlikView App Dev
- :
- Re: Headings that span multiple columns in a pivot...
- Subscribe to RSS Feed
- Mark Topic as New
- Mark Topic as Read
- Float this Topic for Current User
- Bookmark
- Subscribe
- Mute
- Printer Friendly Page
- Mark as New
- Bookmark
- Subscribe
- Mute
- Subscribe to RSS Feed
- Permalink
- Report Inappropriate Content
Headings that span multiple columns in a pivot table
Hi all,
I've got a pivot table that has three month actuals and budget and also total and variance columns. These columns are all defined individually in the expressions as this allows me to add the variances.
I currently have text boxes to span the actuals, budget and variance columns, but obviously any changes in the column widths requires manual changes to the boxes.
I am therefore looking to include these headings in the table itself.
Any ideas?
Thanks!

Each column is defined separately:

- « Previous Replies
-
- 1
- 2
- Next Replies »
- Mark as New
- Bookmark
- Subscribe
- Mute
- Subscribe to RSS Feed
- Permalink
- Report Inappropriate Content
Hi,
Do you have two Separate values as Actuals and Budget or Same Base amount you are defining as Actual and Budget based on some field.
Share me any one expression you have used.
- Mark as New
- Bookmark
- Subscribe
- Mute
- Subscribe to RSS Feed
- Permalink
- Report Inappropriate Content
The only way I've done it is with a concatenated type fact able with the variance calculated in the script. Something like below.
You would add both Month and Type as a dimension. You would only have 1 expression then =Sum(Amount)
Once the pivot table is created, you would move the Type dimension accross the top.
| Month | Type | Amount |
| 1-Jan | Actual | 500 |
| 1-Feb | Actual | 400 |
| 1-Mar | Actual | 300 |
| 1-Jan | Budget | 1000 |
| 1-Feb | Budget | 2000 |
| 1-Mar | Budget | 3000 |
| 1-Jan | Variance | -500 |
| 1-Feb | Variance | -1600 |
| 1-Mar | Variance | -2700 |
- Mark as New
- Bookmark
- Subscribe
- Mute
- Subscribe to RSS Feed
- Permalink
- Report Inappropriate Content
Here is a sample app showing how to,
But you will need change table type to a pivot table and nest all your expressions into a single expression
If a post helps to resolve your issue, please accept it as a Solution.
- Mark as New
- Bookmark
- Subscribe
- Mute
- Subscribe to RSS Feed
- Permalink
- Report Inappropriate Content
Here is an example.
- Mark as New
- Bookmark
- Subscribe
- Mute
- Subscribe to RSS Feed
- Permalink
- Report Inappropriate Content
Hi,
Pls find attached the solution. Create 3 seperate measures in the Pivot table.
Thanks
- Mark as New
- Bookmark
- Subscribe
- Mute
- Subscribe to RSS Feed
- Permalink
- Report Inappropriate Content
Thanks for your help Vineeth,
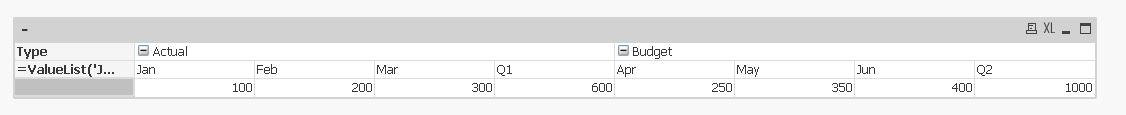
I have tried using the dimension: =ValueList('Jan A','Feb A','Mar A','Total YTD actuals','Jan B','Feb B','Mar B','Total YTD budget') and the expression as below. If I can get this to work I will then look into the variances using the same method.
However, it doesn't seem to work, can you see what I might be doing wrong?
Thanks!

- Mark as New
- Bookmark
- Subscribe
- Mute
- Subscribe to RSS Feed
- Permalink
- Report Inappropriate Content
My data is rows of transactions that are either actual or budget.
This is how my variance is calculated:
=sum({$<[Period]={$(CurrentMonth)},[Year] = {2017}, Actual={Actual} >}([Base amount]/FX))-sum({$<[Period]={$(LastMonth)},[Year] = {2017}, Actual={Actual} >}([Base amount]/FX))
thanks
- Mark as New
- Bookmark
- Subscribe
- Mute
- Subscribe to RSS Feed
- Permalink
- Report Inappropriate Content
Thanks but this only works if I want variances for all months, whereas I'm just looking for MTD and YTD variance columns.
- Mark as New
- Bookmark
- Subscribe
- Mute
- Subscribe to RSS Feed
- Permalink
- Report Inappropriate Content
can you post the app ? it's easier that way
you can scramble the data, refer to the below post
Preparing examples for Upload - Reduction and Data Scrambling
If a post helps to resolve your issue, please accept it as a Solution.
- « Previous Replies
-
- 1
- 2
- Next Replies »