Unlock a world of possibilities! Login now and discover the exclusive benefits awaiting you.
- Qlik Community
- :
- All Forums
- :
- QlikView App Dev
- :
- Help total a column and populate each row of anoth...
- Subscribe to RSS Feed
- Mark Topic as New
- Mark Topic as Read
- Float this Topic for Current User
- Bookmark
- Subscribe
- Mute
- Printer Friendly Page
- Mark as New
- Bookmark
- Subscribe
- Mute
- Subscribe to RSS Feed
- Permalink
- Report Inappropriate Content
Help total a column and populate each row of another column with total
I have a straight table as follows
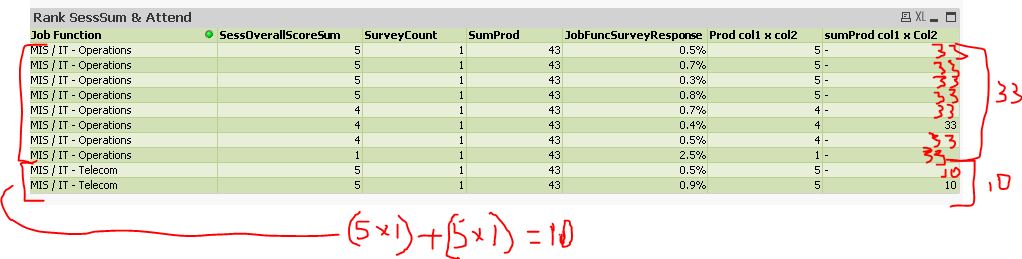
How can I get the right column to show the numbers indicated? i.e. it is a sum of second from right column grouped by Job Function.
Currently this the script in right column
aggr(sum(aggr( sum( aggr([Session Overall] , ATTENDED ) )
* sum( aggr( if ( [Session Overall] >= 1 ,1,0) ,ATTENDED, )),[Session ID] )) ,[Job Function])
- Mark as New
- Bookmark
- Subscribe
- Mute
- Subscribe to RSS Feed
- Permalink
- Report Inappropriate Content
please post your source data or qvw file
- Mark as New
- Bookmark
- Subscribe
- Mute
- Subscribe to RSS Feed
- Permalink
- Report Inappropriate Content
I have uploaded a qvw with sample data. so the goal is to populate the right column with the sum as shown
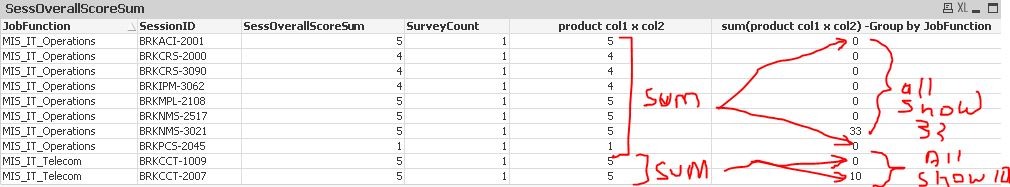
I have the group total showing - on right column - but it only shows in one row. need it in all rows for group.
Any help appreciated