Unlock a world of possibilities! Login now and discover the exclusive benefits awaiting you.
- Qlik Community
- :
- All Forums
- :
- QlikView App Dev
- :
- Re: Help with chart expression - need max effectiv...
- Subscribe to RSS Feed
- Mark Topic as New
- Mark Topic as Read
- Float this Topic for Current User
- Bookmark
- Subscribe
- Mute
- Printer Friendly Page
- Mark as New
- Bookmark
- Subscribe
- Mute
- Subscribe to RSS Feed
- Permalink
- Report Inappropriate Content
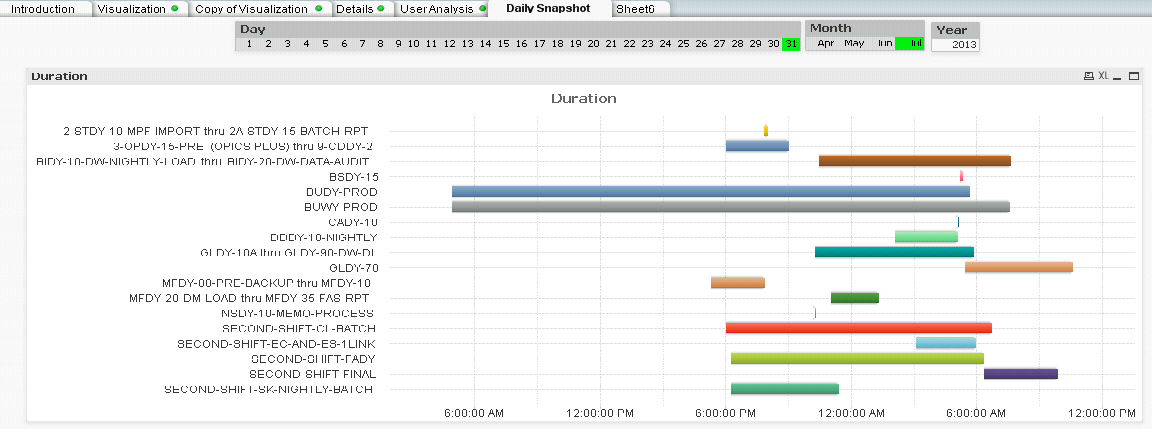
Help with chart expression - need max effective date
Hi,
I have a chart where I have
Max(End_Time)-Min(Start_Time)
as the expression.
I’ve attached an image below.
I need this chart to ignore selections in the document and always display the chart based on the max effective date. I have list boxes set up using the effective date so users can select dates.
Is this possible? I know that you would usually include a 1 identifier in your set analysis to achieve this but I’m not clear on how to include this in my chart expression since I’m not aggregating anything.
Also, would a better approach be to create a standalone table to hold the latest data? I’m not sure how to do this but this was a suggestion I received.
Thanks in advance for any help.
- Mark as New
- Bookmark
- Subscribe
- Mute
- Subscribe to RSS Feed
- Permalink
- Report Inappropriate Content
This expression will ignore all selections:
Max({1}End_Time)-Min({1}Start_Time)
If you want to ignore selections in specific fields you can use something like this:
Max({<MyField1=, MyField2=>}End_Time)-Min({<MyField1=, MyField2=>}Start_Time)
Just add any fields you need in a list separated by commas
talk is cheap, supply exceeds demand
- Mark as New
- Bookmark
- Subscribe
- Mute
- Subscribe to RSS Feed
- Permalink
- Report Inappropriate Content
Thanks for your response. I think using MaxEffDate might be a better approach. I need the chart to show all jobs (dimension) with their duration (expression Max(End_Time)-Min(Start_Time) ).
However, the expression needs to display the duration only for the MaxEffDate. I’m not sure how to add the MaxEffDate to my expression.