Unlock a world of possibilities! Login now and discover the exclusive benefits awaiting you.
- Qlik Community
- :
- All Forums
- :
- QlikView App Dev
- :
- Here's a challenge - and a request for help creati...
- Subscribe to RSS Feed
- Mark Topic as New
- Mark Topic as Read
- Float this Topic for Current User
- Bookmark
- Subscribe
- Mute
- Printer Friendly Page
- Mark as New
- Bookmark
- Subscribe
- Mute
- Subscribe to RSS Feed
- Permalink
- Report Inappropriate Content
Here's a challenge - and a request for help creating a static grid in bubble chart
Hello,
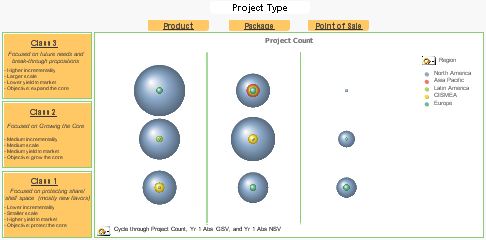
I would like to do the folowing with the bubble chart in the attached .qvw (and pictured below):
- Maintain a static, consistently sized 3 x 3 grid,
- that aligns with the project Class descriptions and Project Type labels included outside of the actual chart,
- where bubbles do not overlap,
- display minor grids only,
- and in a perfect world, define the x and y locations where the dimension values will appear; that is, when looking at Region, specify that the bubble for North America (for example) will always appear in the upper left corner of the specific 'box'
If I can create a static-sized chart with a static grid, then I could add horizontal lines on the y axis to create the illusion of a '9-Box'.
I have tried various approaches unsuccessfully. Is any of this possible? How? If it can be accomplished with a Scatter Chart, that would be ok too.
Any assistance or direction would be greatly appreciated!
Thank you,
Ellen
p.s. I am working in v10.5 and have v11 available
- Mark as New
- Bookmark
- Subscribe
- Mute
- Subscribe to RSS Feed
- Permalink
- Report Inappropriate Content
You have SA protection on the qvw you uploded. What's the uid/pwd to get in?
-Rob
- Mark as New
- Bookmark
- Subscribe
- Mute
- Subscribe to RSS Feed
- Permalink
- Report Inappropriate Content
ADMIN
admin
So sorry for the delay! I am still in need of help.
- Mark as New
- Bookmark
- Subscribe
- Mute
- Subscribe to RSS Feed
- Permalink
- Report Inappropriate Content
Hi Rob,
Just making sure that you saw my response to your request for the uid and pw.
id: ADMIN
pw: admin
Thanks again for taking a look at this. I am looking forward to seeing/hearing something back.
Ellen
- Mark as New
- Bookmark
- Subscribe
- Mute
- Subscribe to RSS Feed
- Permalink
- Report Inappropriate Content
Hi Ellen,
I've looked at it a bit but don't have a solution yet. I'll let you know if I come up with anything.
-Rob