Unlock a world of possibilities! Login now and discover the exclusive benefits awaiting you.
- Qlik Community
- :
- All Forums
- :
- QlikView App Dev
- :
- Hiding one value in chart dimension
- Subscribe to RSS Feed
- Mark Topic as New
- Mark Topic as Read
- Float this Topic for Current User
- Bookmark
- Subscribe
- Mute
- Printer Friendly Page
- Mark as New
- Bookmark
- Subscribe
- Mute
- Subscribe to RSS Feed
- Permalink
- Report Inappropriate Content
Hiding one value in chart dimension
Hi,
Probably it's easy, but I can't figure it...
I have a bar chart with one dimension and few expressions. Let's say, that the dimension has values "A", "B" and "C".
On chart I don't want to show all values on X-axe, but only: A, B, and also B+C and sum A+B+C .
In other words, in attached document I want to hide "C" bar on chart and add "B+C" instead.
How to do this?
Thank you in advance.
Bartek
- « Previous Replies
-
- 1
- 2
- Next Replies »
Accepted Solutions
- Mark as New
- Bookmark
- Subscribe
- Mute
- Subscribe to RSS Feed
- Permalink
- Report Inappropriate Content
There's a function called valuelist. Its use is explained in the help file. Normally the help file is installed when you install Qlikview. Press F1 to open the help file.
See also this blog post: ValueList() – For those tricky situations
talk is cheap, supply exceeds demand
- Mark as New
- Bookmark
- Subscribe
- Mute
- Subscribe to RSS Feed
- Permalink
- Report Inappropriate Content
See attached example
talk is cheap, supply exceeds demand
- Mark as New
- Bookmark
- Subscribe
- Mute
- Subscribe to RSS Feed
- Permalink
- Report Inappropriate Content
This is a solution
- Mark as New
- Bookmark
- Subscribe
- Mute
- Subscribe to RSS Feed
- Permalink
- Report Inappropriate Content
Thank you both.
Gysbert, your solution works great, but it is necessary to modify the script. My app is huge, has many sheets and the model is very complicated - I would like to avoid modifying script just for one chart. Is there some another way to get same result without changing script?
Alessandro, your solution is also ok., thanks, but I must to show at least 2 measures - and here more measures means many more additional expressions, and the presentation will be also less clear.
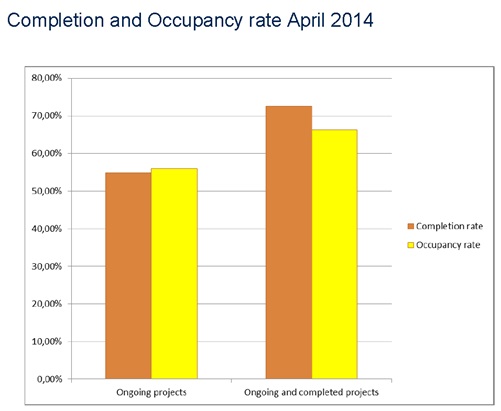
I need to achieve this:effect:
- Mark as New
- Bookmark
- Subscribe
- Mute
- Subscribe to RSS Feed
- Permalink
- Report Inappropriate Content
You could also try using a calculated dimension using the valuelist function. Any performance problems that causes are yours to deal with  .
.
talk is cheap, supply exceeds demand
- Mark as New
- Bookmark
- Subscribe
- Mute
- Subscribe to RSS Feed
- Permalink
- Report Inappropriate Content
For now there are no performance problems, so it is ok.
However I tried to do it using a calculated dimension and I don't know how to do it - because there is one dimension ("Ongoing projects" on screen, or "B" in my qvw example) which I want to have more than one times on chart.
What do you mean by "valuelist function"?
- Mark as New
- Bookmark
- Subscribe
- Mute
- Subscribe to RSS Feed
- Permalink
- Report Inappropriate Content
There's a function called valuelist. Its use is explained in the help file. Normally the help file is installed when you install Qlikview. Press F1 to open the help file.
See also this blog post: ValueList() – For those tricky situations
talk is cheap, supply exceeds demand
- Mark as New
- Bookmark
- Subscribe
- Mute
- Subscribe to RSS Feed
- Permalink
- Report Inappropriate Content
=ValueList('A','B','B+C','Total')
It's called a synthetic dimension (as it's not based on any actual, loaded data). However, it's not connected to the real data in any way whatsoever, so you'd have to take care of it in the expression itself. Instead of just sum(Value) you get:
Pick(Match(ValueList('A','B','B+C','Total'),'A','B','B+C','Total'),
Sum({<Category={'A'}>}Value),
Sum({<Category={'B'}>}Value),
Sum({<Category={'B','C'}>}Value),
Sum({<Category={'A','B','C'}>}Value)
))
My personal opinion on that is it's a bit of an abomination 
- Mark as New
- Bookmark
- Subscribe
- Mute
- Subscribe to RSS Feed
- Permalink
- Report Inappropriate Content
I tried to find "ValueList" function in the help file, but I didn't see it there, so thanks for the link to the blog post - I used it in my situation and it works perfectly.
Thank you!
- Mark as New
- Bookmark
- Subscribe
- Mute
- Subscribe to RSS Feed
- Permalink
- Report Inappropriate Content
Thank you for explanation!
- « Previous Replies
-
- 1
- 2
- Next Replies »