Unlock a world of possibilities! Login now and discover the exclusive benefits awaiting you.
- Qlik Community
- :
- All Forums
- :
- QlikView App Dev
- :
- Re: Hover the mouse
- Subscribe to RSS Feed
- Mark Topic as New
- Mark Topic as Read
- Float this Topic for Current User
- Bookmark
- Subscribe
- Mute
- Printer Friendly Page
- Mark as New
- Bookmark
- Subscribe
- Mute
- Subscribe to RSS Feed
- Permalink
- Report Inappropriate Content
Hover the mouse
Hello all,
I have done with different types of charts in my qlikview dashboard. When I mouse over to particular chart it is showing as count and the expressions which I have given in the chart. But, I want to show some description like some text also when I hover the mouse in the charts. Could you please help me out as soon as possible. Thanks!
- Mark as New
- Bookmark
- Subscribe
- Mute
- Subscribe to RSS Feed
- Permalink
- Report Inappropriate Content
For some type of charts like bar chart, you can add a expression for example like If function = If( '% Met' > 0.5, 'Met', 'Not Met') .
and turn of the bar and keep Text as popup. Any other expression should also work.

- Mark as New
- Bookmark
- Subscribe
- Mute
- Subscribe to RSS Feed
- Permalink
- Report Inappropriate Content
I have only count( sales) that expression. How can I apply if condition in that. Suppose I put title as volume of sales. When I hover the mouse over that chart I am able to see the count along with that I need show up the definitation of some thing atleast 2 lines
- Mark as New
- Bookmark
- Subscribe
- Mute
- Subscribe to RSS Feed
- Permalink
- Report Inappropriate Content
The if function was just an example. You can add new expression and make it to show up as Text popup along with you count(sales) expression.
What do you want to show up ? Provide some more details.
- Mark as New
- Bookmark
- Subscribe
- Mute
- Subscribe to RSS Feed
- Permalink
- Report Inappropriate Content
I mean like, I need to show the definition of volume of sales( as an example am saying) it will contain 2 to 3 lines of sentences. How can I achieve this please help me as soon as possible. Thanks!!
- Mark as New
- Bookmark
- Subscribe
- Mute
- Subscribe to RSS Feed
- Permalink
- Report Inappropriate Content
Add a new expression. You expression can be as below.
Replace the line as required within the single quote. Chr(13) will insert new line.
= 'This is the definition of the Volume of Sales' &
chr(13) & 'Line 1'
& chr(13) & 'Line 2'
- Mark as New
- Bookmark
- Subscribe
- Mute
- Subscribe to RSS Feed
- Permalink
- Report Inappropriate Content
This is not showing up correctly. I implemented calculated dimension with one expression. For Calculated dimension I used pick and match function along with other field. I made line chart. when I gave another expression which you mentioned above it not showing me 3 lines it is showing me only one line and text is not showing up. Please help me for this issue.
- Mark as New
- Bookmark
- Subscribe
- Mute
- Subscribe to RSS Feed
- Permalink
- Report Inappropriate Content
What are your expressions ? Without expression, cannot help. Provide screenshots, expression or qvw file to help.
Also try to use Combo chart instead of line chart. I think line chart does not support popup as label.
- Mark as New
- Bookmark
- Subscribe
- Mute
- Subscribe to RSS Feed
- Permalink
- Report Inappropriate Content
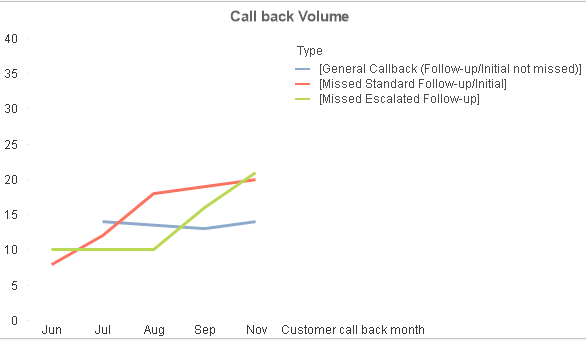
Customer chat reached queue and there was interaction between the agent and customer (chats accepted)- as text when I hover the mouse over the chart.
I have expressions and dimensions like this: I showed in the screen shots.
When I applied your expression in the expression tab it is showing me only one line with no text .
- Mark as New
- Bookmark
- Subscribe
- Mute
- Subscribe to RSS Feed
- Permalink
- Report Inappropriate Content
Try Combo chart and use the line for each expression.