Unlock a world of possibilities! Login now and discover the exclusive benefits awaiting you.
- Qlik Community
- :
- All Forums
- :
- QlikView App Dev
- :
- How a Filter in Alternate State will be use in set...
Options
- Subscribe to RSS Feed
- Mark Topic as New
- Mark Topic as Read
- Float this Topic for Current User
- Bookmark
- Subscribe
- Mute
- Printer Friendly Page
Turn on suggestions
Auto-suggest helps you quickly narrow down your search results by suggesting possible matches as you type.
Showing results for
Creator
2013-07-31
09:02 PM
- Mark as New
- Bookmark
- Subscribe
- Mute
- Subscribe to RSS Feed
- Permalink
- Report Inappropriate Content
How a Filter in Alternate State will be use in set analyis
Hi Guys,
Im into set analysis and alternate state, in my current project i set 2 alternate both have the same dimensions and allthe results are also display in pivot charts.
/see image :
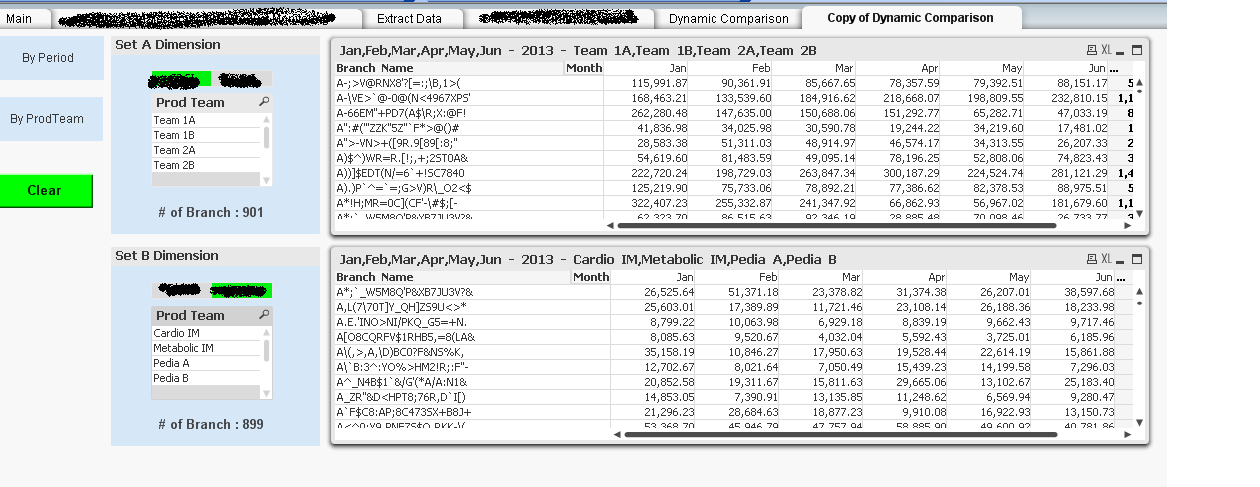
i want to make a comparison graph that represent what i have in the pivot tables.
what i initially want is to get the summary per month (of all brnach listed) and compare in in a bar graph.
434 Views
1 Reply
Creator
2013-07-31
09:41 PM
Author
- Mark as New
- Bookmark
- Subscribe
- Mute
- Subscribe to RSS Feed
- Permalink
- Report Inappropriate Content
this helps me ... in my requirements... tnx