Unlock a world of possibilities! Login now and discover the exclusive benefits awaiting you.
- Qlik Community
- :
- All Forums
- :
- QlikView App Dev
- :
- Re: How can I do conditional coloring based on the...
- Subscribe to RSS Feed
- Mark Topic as New
- Mark Topic as Read
- Float this Topic for Current User
- Bookmark
- Subscribe
- Mute
- Printer Friendly Page
- Mark as New
- Bookmark
- Subscribe
- Mute
- Subscribe to RSS Feed
- Permalink
- Report Inappropriate Content
How can I do conditional coloring based on the category columns?
I have 8 columns as you can see below.

6 of the columns (Gesamtbewertung, Qualität, Logistik, Einkauf und Vertrieb, Service, Umwelt) are representing different categories shown as “speed indicators”. Additionally the amount of the speed indicator is shown in numbers on an extra display.
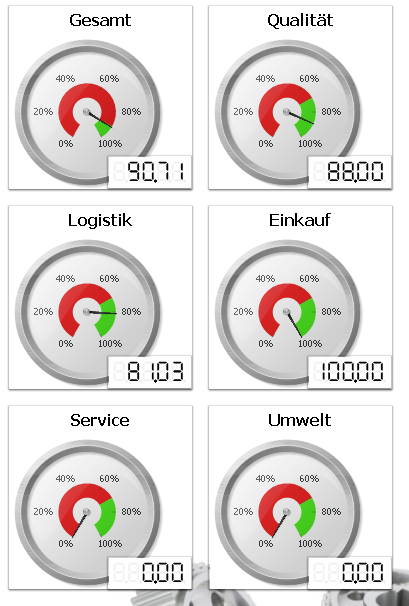
Well, I would like to mark the numbers shown in the displays
GREEN if the amount is =>90
RED if the amount is < 90
Black if the amount = 0
The displays are based on the different categories (Gesamtbewertung, Qualität, Logistik, Einkauf und Vertrieb, Service, Umwelt). For each category one display.
The amount which is shown at the display representing the latest worth of this category.
We created two different formulas but it didn`t work.
if([Bottom(sum(bew_Logistik))]<=90,red(),if([Bottom(sum(bew_Logistik))]=0,blue(),green()))
if(Bottom(sum(bew_Service))<=90,rgb(255,0,0),rgb(0,255,0))
Really don’t know how to do this and need your help please. You also can answer in German if you can.
Thanks
- Mark as New
- Bookmark
- Subscribe
- Mute
- Subscribe to RSS Feed
- Permalink
- Report Inappropriate Content
Hi,
In the straight chart it shows the value as %. How did you format your value using the Number Tab?
May be try like this (instead of 90, change 0.9)
=if(Bottom(sum(bew_Logistik))<=0.9,red(),
if(Bottom(sum(bew_Logistik))=0,blue(),green()))
=if(Bottom(sum(bew_Service))<=0.9,rgb(255,0,0),rgb(0,255,0))
Can you post the sample,if it is not working?
- Mark as New
- Bookmark
- Subscribe
- Mute
- Subscribe to RSS Feed
- Permalink
- Report Inappropriate Content
Hey guys,
now it works. The formula with if...if... works.
Thanks again for your help.