Unlock a world of possibilities! Login now and discover the exclusive benefits awaiting you.
- Qlik Community
- :
- All Forums
- :
- QlikView App Dev
- :
- How to add a gray box/border around a bar chart?
- Subscribe to RSS Feed
- Mark Topic as New
- Mark Topic as Read
- Float this Topic for Current User
- Bookmark
- Subscribe
- Mute
- Printer Friendly Page
- Mark as New
- Bookmark
- Subscribe
- Mute
- Subscribe to RSS Feed
- Permalink
- Report Inappropriate Content
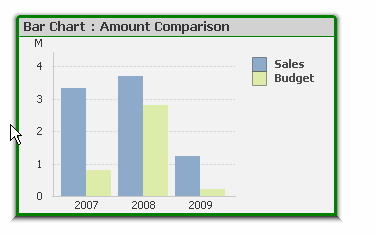
How to add a gray box/border around a bar chart?
Hi All, I have this design request for a bar chart and am not sure how or if there is a place to do it. (Reporting team is working to make the graphs from qlikview blend in better with graphs from other sources design-wise.)
"Is it possible to put the whole graph in a gray box? R=242, G = 242, B = 242"
Other fun fact, we just acquired nprinting. If above is not possible in qlikview, is it possible with nprinting if I move the data onto excel or powerpoint and make those produce the graph from it? (Such feels possible, but we're totally new with nprinting and still working our way through the basic training stuff on the design side.)
Accepted Solutions
- Mark as New
- Bookmark
- Subscribe
- Mute
- Subscribe to RSS Feed
- Permalink
- Report Inappropriate Content
background or border?
background in color tab, background
border in layout tab (after you hoose styling mode --> advanced in menù --> settings --> document properties --> general)
- Mark as New
- Bookmark
- Subscribe
- Mute
- Subscribe to RSS Feed
- Permalink
- Report Inappropriate Content
(nprinting question is about making a powerpoint or excel template in nprinting so nprinting can include converting the data to the desired graph design in its work.)
- Mark as New
- Bookmark
- Subscribe
- Mute
- Subscribe to RSS Feed
- Permalink
- Report Inappropriate Content
you can add borders around objects in QlikView and determine the color as well - on the layout tabl of the object check Use Borders, select the width and intesity and you can click the color and define the color you wish to use

- Mark as New
- Bookmark
- Subscribe
- Mute
- Subscribe to RSS Feed
- Permalink
- Report Inappropriate Content
regarding your nprinting question, you can bring data into the template as a table for example, and then convert the table to a chart.
see the attached link
- Mark as New
- Bookmark
- Subscribe
- Mute
- Subscribe to RSS Feed
- Permalink
- Report Inappropriate Content
background or border?
background in color tab, background
border in layout tab (after you hoose styling mode --> advanced in menù --> settings --> document properties --> general)
- Mark as New
- Bookmark
- Subscribe
- Mute
- Subscribe to RSS Feed
- Permalink
- Report Inappropriate Content
if the object in qlikview is already a chart, you can bring it into nprinting as an image of the chart, without having to go through the conversion process
- Mark as New
- Bookmark
- Subscribe
- Mute
- Subscribe to RSS Feed
- Permalink
- Report Inappropriate Content
Turned out they meant the background, so I've applied that solution. (solid box vs hollow box. I will be sure to clarify border or background next time someone says 'box'.  ) Correct and helpful answers all around. Thanks!
- Mark as New
- Bookmark
- Subscribe
- Mute
- Subscribe to RSS Feed
- Permalink
- Report Inappropriate Content
Good to hear and glad you were able to give them what they needed
take care