Unlock a world of possibilities! Login now and discover the exclusive benefits awaiting you.
- Qlik Community
- :
- All Forums
- :
- QlikView App Dev
- :
- Re: How to add percentage change in line chart
- Subscribe to RSS Feed
- Mark Topic as New
- Mark Topic as Read
- Float this Topic for Current User
- Bookmark
- Subscribe
- Mute
- Printer Friendly Page
- Mark as New
- Bookmark
- Subscribe
- Mute
- Subscribe to RSS Feed
- Permalink
- Report Inappropriate Content
How to add percentage change in line chart
Dear community,
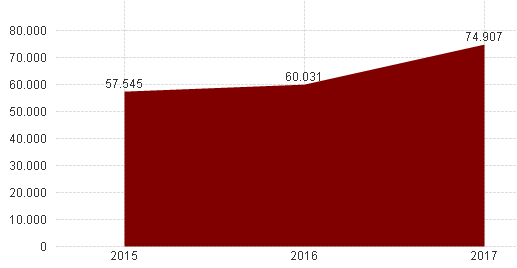
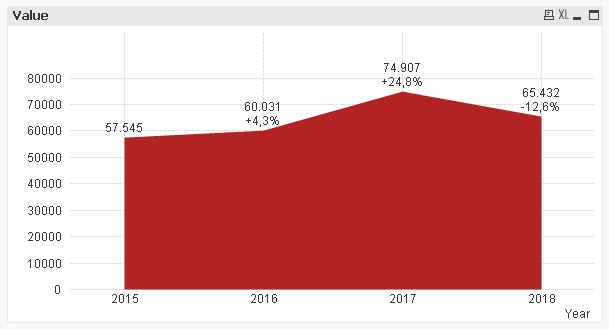
i would like to add the year to year change in percentage points to a graph like this (~ 4,3 % for 2016 and ~ 24,8% for 2017).
Is there a simple way to add this piece of information to the graph?
Thanks and Best regards
Accepted Solutions
- Mark as New
- Bookmark
- Subscribe
- Mute
- Subscribe to RSS Feed
- Permalink
- Report Inappropriate Content
Hi,
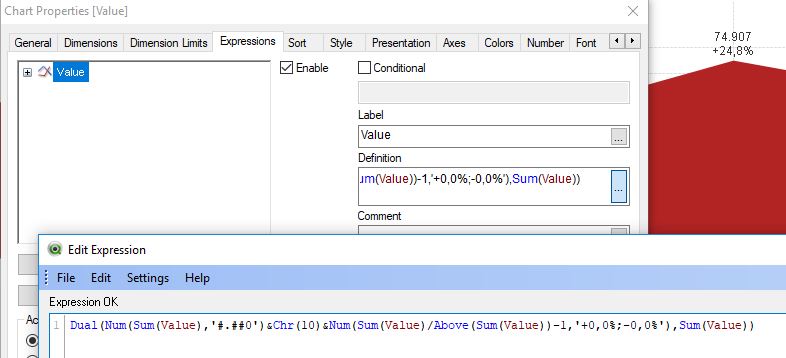
you could use the Dual() function to add this information to your expression like this:
Dual(Num(Sum(Value),'#.##0')&Chr(10)&Num(Sum(Value)/Above(Sum(Value))-1,'+0,0%;-0,0%'),Sum(Value))
hope this helps
regards
Marco
- Mark as New
- Bookmark
- Subscribe
- Mute
- Subscribe to RSS Feed
- Permalink
- Report Inappropriate Content
Hi,
you could use the Dual() function to add this information to your expression like this:
Dual(Num(Sum(Value),'#.##0')&Chr(10)&Num(Sum(Value)/Above(Sum(Value))-1,'+0,0%;-0,0%'),Sum(Value))
hope this helps
regards
Marco
- Mark as New
- Bookmark
- Subscribe
- Mute
- Subscribe to RSS Feed
- Permalink
- Report Inappropriate Content
Dear Marco,
Thank you very much for your rapid! and outstanding! support.
First, I copy pasted the expression into my file and adjusted it to my dimensions BUT the graph did not change accordingly. Instead the graph still looked like a regular "sum()" graph.
Then I copied the object from your attached qvw file into my sheet and adjusted the expression. It worked! I am still figuring out what I missed but I am very thankful.
Best regards
- Mark as New
- Bookmark
- Subscribe
- Mute
- Subscribe to RSS Feed
- Permalink
- Report Inappropriate Content
Hi,
you're welcome.
Glad it helped.
Maybe you had some number format applied to your chart expression (needs to be "expression default". see number tab in chart properties).
regards
Marco