Unlock a world of possibilities! Login now and discover the exclusive benefits awaiting you.
- Qlik Community
- :
- All Forums
- :
- QlikView App Dev
- :
- How to calculate the lower values in a chart with ...
- Subscribe to RSS Feed
- Mark Topic as New
- Mark Topic as Read
- Float this Topic for Current User
- Bookmark
- Subscribe
- Mute
- Printer Friendly Page
- Mark as New
- Bookmark
- Subscribe
- Mute
- Subscribe to RSS Feed
- Permalink
- Report Inappropriate Content
How to calculate the lower values in a chart with two dimensions?
Hello everyone,
Does someone know how to calculate a Min expression in a chart with two dimensions?
The idea is recreate the next chart but using two dimensions (the second dimension returns me the correct number of blue dots)
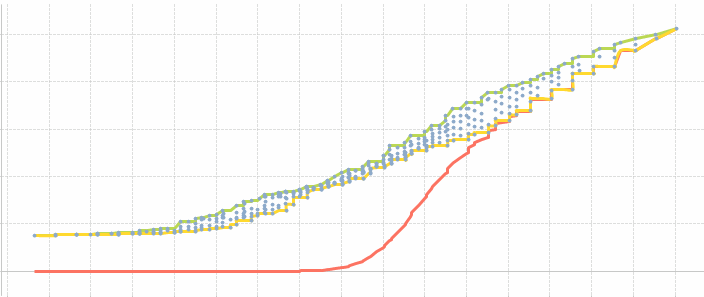
The blue line that we see is a MAX line.
The expression for it is: If ( Rank(Sum(PROD)) = 1, Sum(PROD))
But for the min line I can have a rank between 2 and 4. So I use the Rank = 2 or Rank >= 2 because I will get more than one min value.
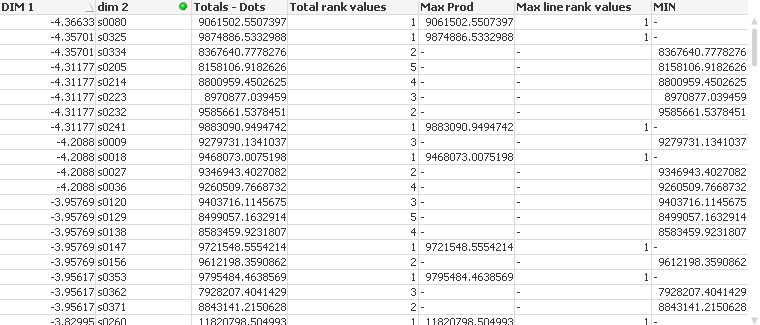
The expressions used are:
I hope someone can help me.
The sugestions present in the forum can't help me, because I need to be able to select values in lines and dots. So having two charts ( one on the top of each other) is not an option.
Kind regards
Dulce Sleeckx
- Mark as New
- Bookmark
- Subscribe
- Mute
- Subscribe to RSS Feed
- Permalink
- Report Inappropriate Content
Is
If ( Rank( -Column(1)) =1, Column(1))
what you are looking for (Note the minus in front of the first Column(1))?