Unlock a world of possibilities! Login now and discover the exclusive benefits awaiting you.
- Qlik Community
- :
- All Forums
- :
- QlikView App Dev
- :
- Re: How to change the x-axis start month?
- Subscribe to RSS Feed
- Mark Topic as New
- Mark Topic as Read
- Float this Topic for Current User
- Bookmark
- Subscribe
- Mute
- Printer Friendly Page
- Mark as New
- Bookmark
- Subscribe
- Mute
- Subscribe to RSS Feed
- Permalink
- Report Inappropriate Content
How to change the x-axis start month?
Hi,
I'm doing a chart with the accumulation 12 functionality.
My problem with the chart, I would like to show only the results after the initial 12 month accumulation.
In Qlikview I didnt find a way to make the chart start after the 12 months without selecting the data.
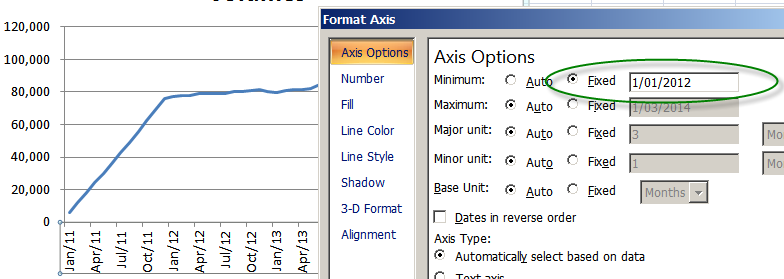
Please see below my chart in qlikview
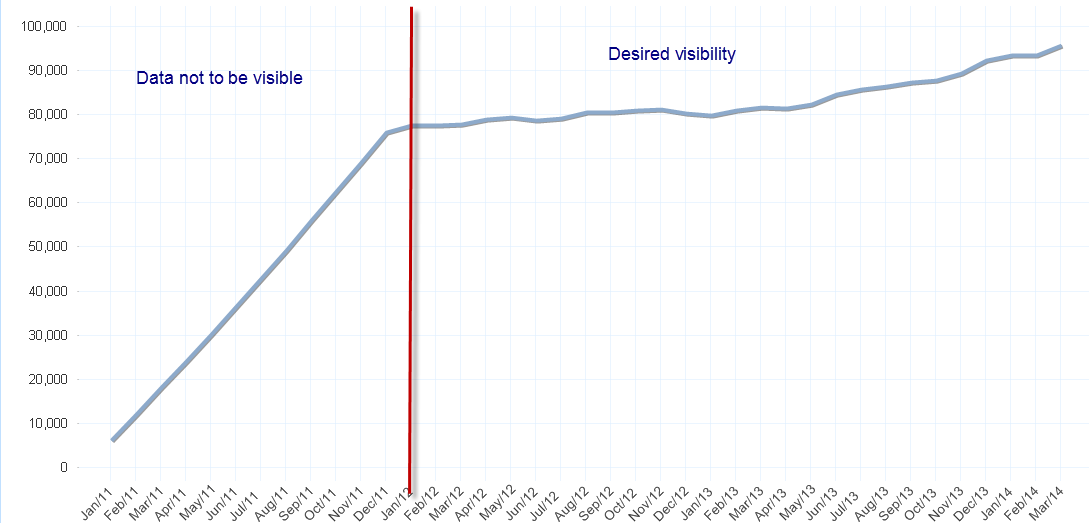
and the idea is to have the following functionaly (I have did this in excel as example)
Please find enclosed the example data report
I appreciate your support!
Thanks in advance, Leandro
Accepted Solutions
- Mark as New
- Bookmark
- Subscribe
- Mute
- Subscribe to RSS Feed
- Permalink
- Report Inappropriate Content
Create a Line Chart
Dimension
Add Calculated Dimension
=IF(Month > 12, Month)
Tick Suppress When Value is Null
Expression (REF: Henric)
Aggr(RangeSum(Above(SUM(Data),0,12)),Month)
Hope this helps...
- Mark as New
- Bookmark
- Subscribe
- Mute
- Subscribe to RSS Feed
- Permalink
- Report Inappropriate Content
This is not possible using this type of accumulation. The accumulation is made on the possible data; and the graph shows the possible months: Then that is what the curve looks like.
What you can do instead is the following:
- As expression, use: Sum(Aggr(RangeSum(Above(Sum ({$<Month=>} Data),0,12)),Month))
- Turn off the accumulation
Then you can select the months you want to see, and the expression will calculate a 12-month accumulation also outside the scope of the selection.
See more on:Calculating rolling n-period totals, averages or other aggregations
HIC
- Mark as New
- Bookmark
- Subscribe
- Mute
- Subscribe to RSS Feed
- Permalink
- Report Inappropriate Content
Create a Line Chart
Dimension
Add Calculated Dimension
=IF(Month > 12, Month)
Tick Suppress When Value is Null
Expression (REF: Henric)
Aggr(RangeSum(Above(SUM(Data),0,12)),Month)
Hope this helps...