Unlock a world of possibilities! Login now and discover the exclusive benefits awaiting you.
- Qlik Community
- :
- All Forums
- :
- QlikView App Dev
- :
- Re: How to create continuous line chart with weekn...
- Subscribe to RSS Feed
- Mark Topic as New
- Mark Topic as Read
- Float this Topic for Current User
- Bookmark
- Subscribe
- Mute
- Printer Friendly Page
- Mark as New
- Bookmark
- Subscribe
- Mute
- Subscribe to RSS Feed
- Permalink
- Report Inappropriate Content
How to create continuous line chart with weeknames
Hi,
I ran into some difficulties with the following chart:
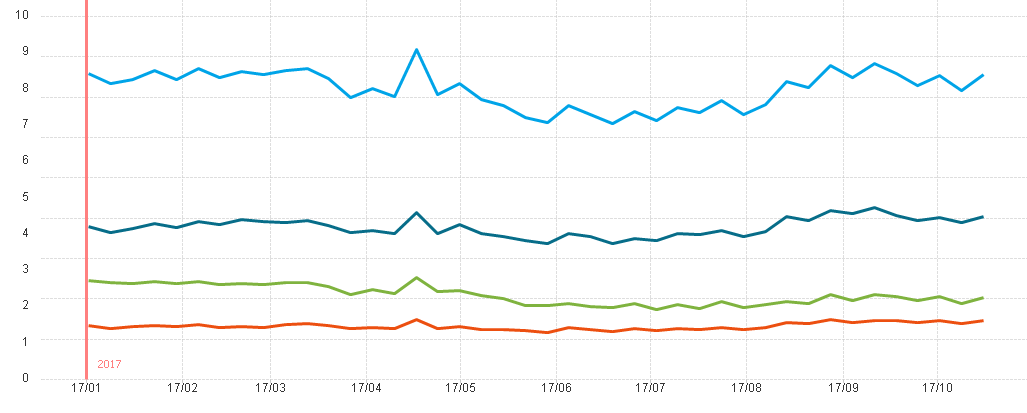
This looks almost exactly how I wanted it to look like, except that the x-axis shouldn't be the months but the weeknumbers. I need it to be a continuous axis, because I want to add vertical reference lines to show when a year starts. Is there a way to format the continuous x-axis that the weeknames are shown?
Any help would be appreciated, thank you.
Best regards,
Flo
- Mark as New
- Bookmark
- Subscribe
- Mute
- Subscribe to RSS Feed
- Permalink
- Report Inappropriate Content
Have you tried
weekname(YourDayDate) as WeekNo
in your script and then use that as the dimension instead?
- Mark as New
- Bookmark
- Subscribe
- Mute
- Subscribe to RSS Feed
- Permalink
- Report Inappropriate Content
Hi Wallo,
thank you for your answer. The dimension is already the weekname. As you can see, there are roughly always four datapoints per month, which indicates that. The only issue I have is that the axis itself doesn't show the weeknames anymore, if I need the axis to be continuous.
- Mark as New
- Bookmark
- Subscribe
- Mute
- Subscribe to RSS Feed
- Permalink
- Report Inappropriate Content
Go to properties and the Axis tab. make the static step 1.
(Assuming you're in Qlikview)