Unlock a world of possibilities! Login now and discover the exclusive benefits awaiting you.
- Qlik Community
- :
- All Forums
- :
- QlikView App Dev
- :
- Re: How to display Roll 12 Month Last Year in the ...
- Subscribe to RSS Feed
- Mark Topic as New
- Mark Topic as Read
- Float this Topic for Current User
- Bookmark
- Subscribe
- Mute
- Printer Friendly Page
- Mark as New
- Bookmark
- Subscribe
- Mute
- Subscribe to RSS Feed
- Permalink
- Report Inappropriate Content
How to display Roll 12 Month Last Year in the same chart?
Hi everyone,
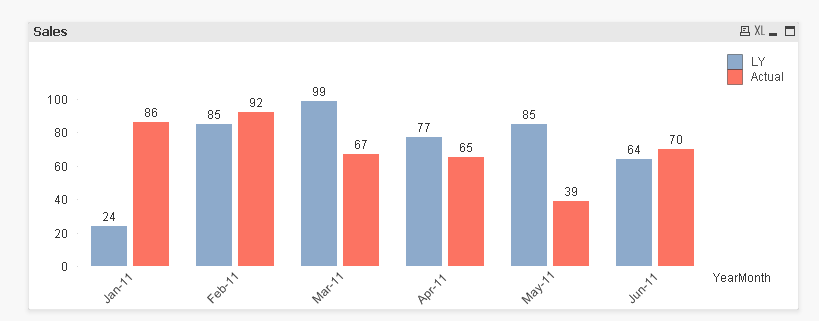
i've just created a chart in which is possible to display the last 12 month in roll.
But now my issue is to display in the same chart the value of last month-year. Where the dimension is June 2011, I would like to display the sales of June 2011 and the sales of June 2010...where the dimension is May 2011, I would like to display the sales of May 2011 and the sales of May 2010...etc...
I hope I was clear enough.
I attach here my qvw to solve it.
gwassenaar i'm sure you can help me...
Accepted Solutions
- Mark as New
- Bookmark
- Subscribe
- Mute
- Subscribe to RSS Feed
- Permalink
- Report Inappropriate Content
May be this:
Expression for LY
If(Actual > 0, Above(Sum({<YearMonth = >}Sales), 12))
- Mark as New
- Bookmark
- Subscribe
- Mute
- Subscribe to RSS Feed
- Permalink
- Report Inappropriate Content
May be this:
Expression for LY
If(Actual > 0, Above(Sum({<YearMonth = >}Sales), 12))
- Mark as New
- Bookmark
- Subscribe
- Mute
- Subscribe to RSS Feed
- Permalink
- Report Inappropriate Content
That's what i was looking for. Thank u so much sunindia!!! 
- Mark as New
- Bookmark
- Subscribe
- Mute
- Subscribe to RSS Feed
- Permalink
- Report Inappropriate Content
No problem 
I am glad I was able to help.
Best,
Sunny
- Mark as New
- Bookmark
- Subscribe
- Mute
- Subscribe to RSS Feed
- Permalink
- Report Inappropriate Content
Hi sunindia,
do u know why when I filter a single month it can't be displayed the LY value?
Could u see my new attachment here please?
thx as usual
- Mark as New
- Bookmark
- Subscribe
- Mute
- Subscribe to RSS Feed
- Permalink
- Report Inappropriate Content
You made a selection in DateMonth field, all the calendar field where you might make a selection need to go in here for the expression to work properly:
If(Actual > 0, Above(Sum({<YearMonth = , DateMonth = , OtherCalendarFields = >}Sales), 12))