Unlock a world of possibilities! Login now and discover the exclusive benefits awaiting you.
- Qlik Community
- :
- All Forums
- :
- QlikView App Dev
- :
- Re: How to display charts with button?
- Subscribe to RSS Feed
- Mark Topic as New
- Mark Topic as Read
- Float this Topic for Current User
- Bookmark
- Subscribe
- Mute
- Printer Friendly Page
- Mark as New
- Bookmark
- Subscribe
- Mute
- Subscribe to RSS Feed
- Permalink
- Report Inappropriate Content
How to display charts with button?
hi ,
I displayed bar chart with button. and I try to display another line chart with button.when I try to display line chart with button this not work to me.I want to display another chart with button.pls tell me out how to display line chart with button.I attached images below this mail .pls solve my problem.I want to display like this my chart If i click my button the chart displayed and click again my button the chart hide .i want to do this pls help me.
Thank you,
Regards
Madhu.
- « Previous Replies
-
- 1
- 2
- Next Replies »
- Mark as New
- Bookmark
- Subscribe
- Mute
- Subscribe to RSS Feed
- Permalink
- Report Inappropriate Content
edit the properties of the button, and add an action to set a variable like vShowChart=1. then edit the chart properties, layout tab, and add the show condition: vShowChart=1. You may want to have another button for 'Hide Chart', where it sets the variable vShowChart=0
- Mark as New
- Bookmark
- Subscribe
- Mute
- Subscribe to RSS Feed
- Permalink
- Report Inappropriate Content
and in case you want to use the same button for hide and show you can set the action for vShowChart = If(vShowChart = 1, 0, 1)

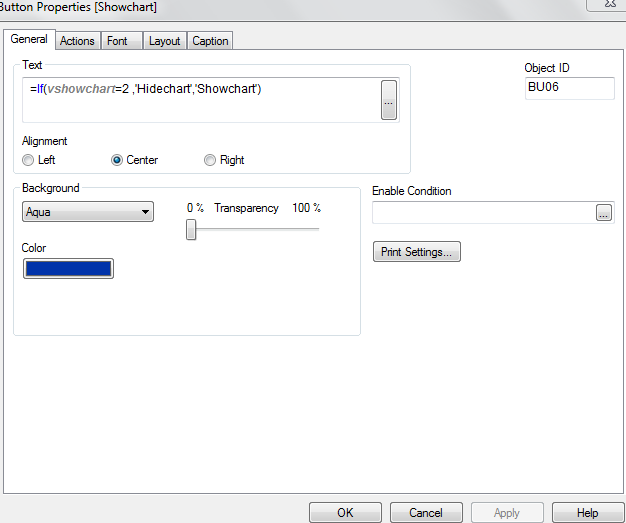
you can then use the following text so that the button tells you what you want to do next:
and for your chart use conditional hide/show conditions for both your charts:
vShowChart = 1 for one chart
vShowChart = 0 for other chart
HTH
Best,
Sunny
- Mark as New
- Bookmark
- Subscribe
- Mute
- Subscribe to RSS Feed
- Permalink
- Report Inappropriate Content
Hi Madhu
Check out this link .This gives what you need
Re: How to show/hide an Object using a Button
Thanks
- Mark as New
- Bookmark
- Subscribe
- Mute
- Subscribe to RSS Feed
- Permalink
- Report Inappropriate Content
hello tammy gibson,
Thankyou for replying me.I displayed already a barchart in like =if(vshowhide=1,0,1) and give layout tab in conditional box like this vshowhide=0.it works perfectily but the problem is I displayed another line chart like this
=if(vshowhide=2,1,2) go to layout tab in conditional box i write like this vshowhide=1.but it does not work to for another chart.pls tell me out and solve my problem.pls
Thankyou,
Regards
madhu
- Mark as New
- Bookmark
- Subscribe
- Mute
- Subscribe to RSS Feed
- Permalink
- Report Inappropriate Content
hi-
use a different variable for the line chart, and see what happens. perhaps using the same variable for both charts is confusing...
- Mark as New
- Bookmark
- Subscribe
- Mute
- Subscribe to RSS Feed
- Permalink
- Report Inappropriate Content
hello gibson,
I use another variable but its not working to me.can you send example display 2 charts with 2 separate buttons .
Thankyou,
Regards
Madhu
- Mark as New
- Bookmark
- Subscribe
- Mute
- Subscribe to RSS Feed
- Permalink
- Report Inappropriate Content
hi-
attached is a simple qvw for you to look at-
- Mark as New
- Bookmark
- Subscribe
- Mute
- Subscribe to RSS Feed
- Permalink
- Report Inappropriate Content
hello gibson ,
I fallowed as it is your instructions but it does not work to me gibson.
I explain everything about Button and bar chart with images .
- I created The first button and Bar chart like this below. it works perfectly.
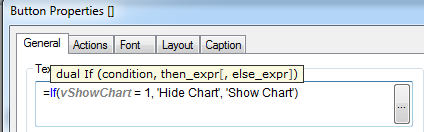
- 1.General tab
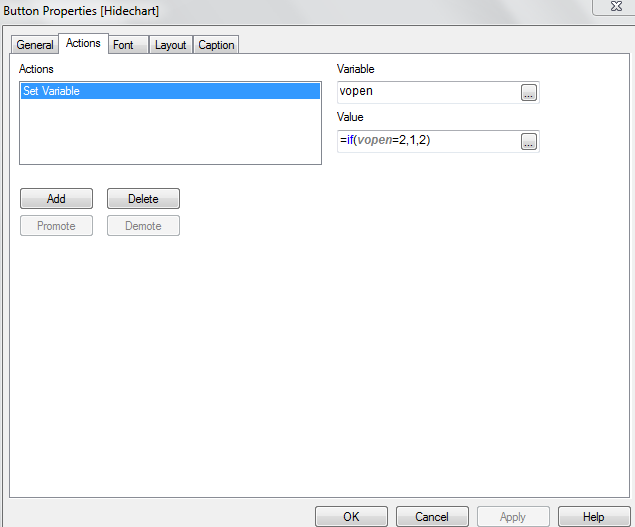
2.Actions tab.
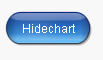
3Button
I created Bar chart like this below.
4.Barchart layout tab.
5.Bar chart Layout.

6.Barchart.
The above Button and Barchart works perfectly.
2.I face the problem with another button and Line chart .see images
The below button and barchart did not work
I created 2 button like this.
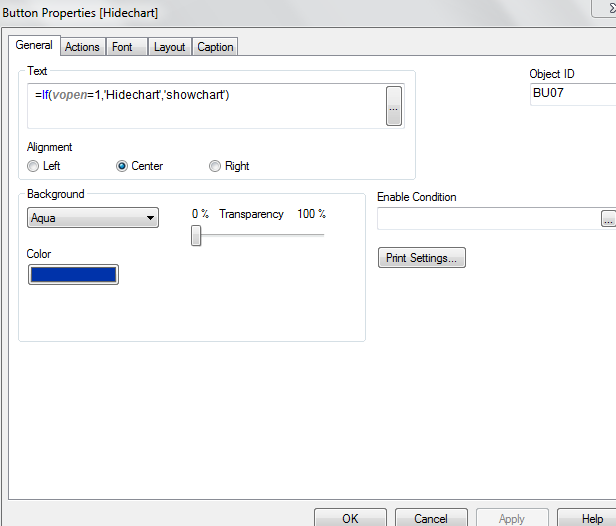
1.Button 2 General tab image
2.Button 2 Actions tab Image.

3. Button 2 object image.
I created Line chart like this.
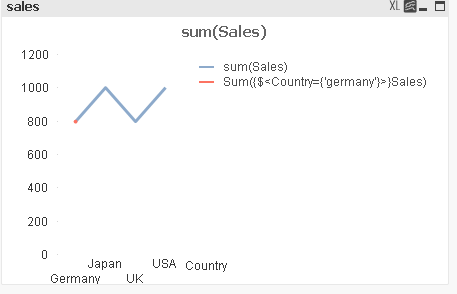
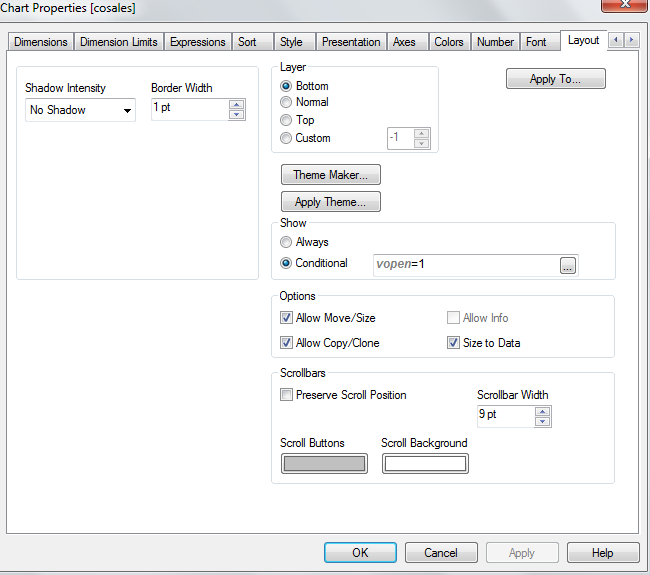
1.Line chart layout tab.

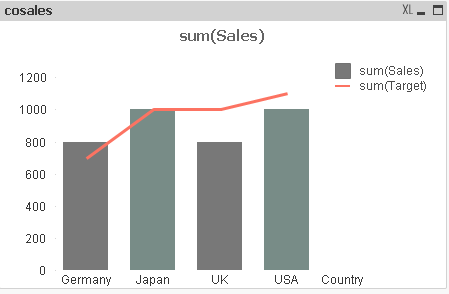
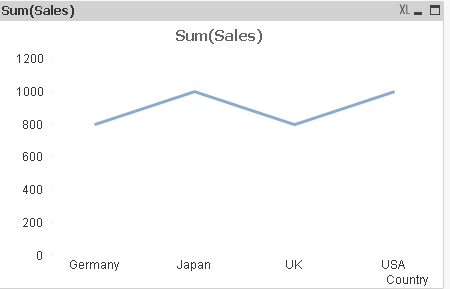
2.Line chart image.
The above chart and button did not work. pls solve my problem.
Thankyou,
Regards
Madhu.
- Mark as New
- Bookmark
- Subscribe
- Mute
- Subscribe to RSS Feed
- Permalink
- Report Inappropriate Content
Hi,
Try this
- « Previous Replies
-
- 1
- 2
- Next Replies »