Unlock a world of possibilities! Login now and discover the exclusive benefits awaiting you.
- Qlik Community
- :
- All Forums
- :
- QlikView App Dev
- :
- Re: How to display or hide objects
- Subscribe to RSS Feed
- Mark Topic as New
- Mark Topic as Read
- Float this Topic for Current User
- Bookmark
- Subscribe
- Mute
- Printer Friendly Page
- Mark as New
- Bookmark
- Subscribe
- Mute
- Subscribe to RSS Feed
- Permalink
- Report Inappropriate Content
How to display or hide objects
I have two different objects (graphics) that can not be displayed at once. The display rule is simple: If no filter is selected
I display object A, but if a filter was done, I display the object B. How do?
Accepted Solutions
- Mark as New
- Bookmark
- Subscribe
- Mute
- Subscribe to RSS Feed
- Permalink
- Report Inappropriate Content
Hi Roberto,
I would use the show conditional in Properties > Layout > Show
Type in GetSelectedCount(CompanyField) = 0 on the Chart to show when no company is selected and > 1 for the other.
Hope this helps...
- Mark as New
- Bookmark
- Subscribe
- Mute
- Subscribe to RSS Feed
- Permalink
- Report Inappropriate Content
Hi,
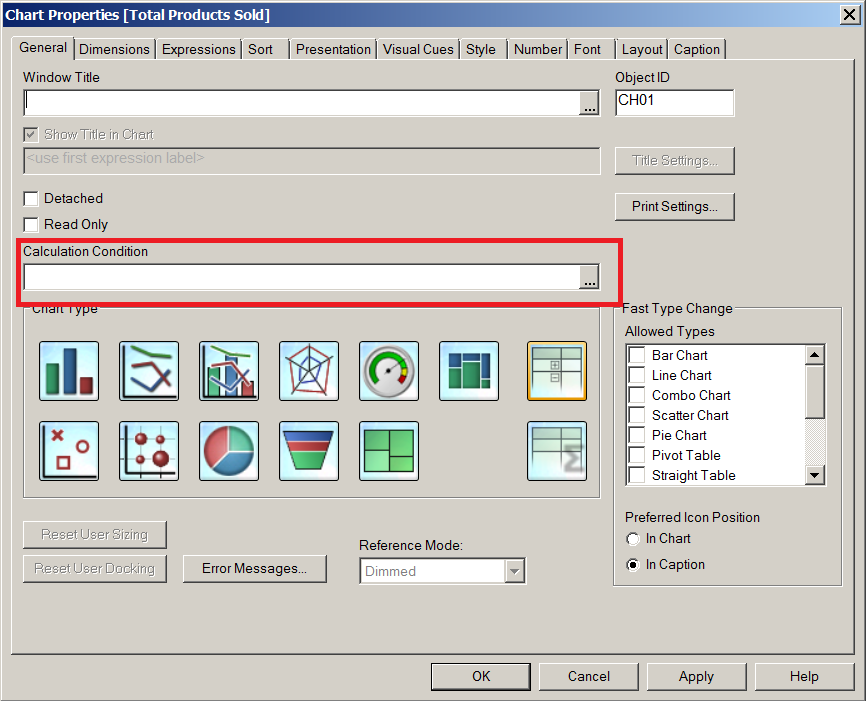
In the Calculation Condtion is where you would put the vaule to show or hide. As an example if I put in =0 it would hide the information.
Bill
To help users find verified answers, please don't forget to use the "Accept as Solution" button on any posts that helped you resolve your problem or question.
- Mark as New
- Bookmark
- Subscribe
- Mute
- Subscribe to RSS Feed
- Permalink
- Report Inappropriate Content
Hi
PFA
Please close the thread by marking correct answer & give likes if you like the post.
- Mark as New
- Bookmark
- Subscribe
- Mute
- Subscribe to RSS Feed
- Permalink
- Report Inappropriate Content
Ok, but my question is how to put the rule. The rule to show or hide the object is the existence (or not) of selection in a list. For example, I have a list with 3 companies. If no company is selected, I have to show a graphic, but if one or more are selected, I have to show another chart and never the two graphs at the same time.
- Mark as New
- Bookmark
- Subscribe
- Mute
- Subscribe to RSS Feed
- Permalink
- Report Inappropriate Content
Hi,
This should help. All I'm doing is changing a variable value.
To help users find verified answers, please don't forget to use the "Accept as Solution" button on any posts that helped you resolve your problem or question.
- Mark as New
- Bookmark
- Subscribe
- Mute
- Subscribe to RSS Feed
- Permalink
- Report Inappropriate Content
Hi Roberto,
I would use the show conditional in Properties > Layout > Show
Type in GetSelectedCount(CompanyField) = 0 on the Chart to show when no company is selected and > 1 for the other.
Hope this helps...
- Mark as New
- Bookmark
- Subscribe
- Mute
- Subscribe to RSS Feed
- Permalink
- Report Inappropriate Content
Ok, I understand what you did ... but unfortunately does not help me yet ... you are showing the object according to the variable and you use an object action button to set this variable. My problem is how to identify (can be a variable) whether there is any selection made one a specific list. Example: I have a list object with 3 companies, one or more companies have been selected, show an object, if none selected, show another company.
- Mark as New
- Bookmark
- Subscribe
- Mute
- Subscribe to RSS Feed
- Permalink
- Report Inappropriate Content
Thank you, tested and really do what I need. But my problem now is another. I need to show a graph or the other, but when one of them does not meet the condition "GetSelectedCount (CompanyField)" it's still there, but a text showing that the condition was not satisfied and calculating overlapping the chart that I need to show. Can you help me with this?
- Mark as New
- Bookmark
- Subscribe
- Mute
- Subscribe to RSS Feed
- Permalink
- Report Inappropriate Content
Hi,
Yes, you set this on the general tab with the error button.
Bill
To help users find verified answers, please don't forget to use the "Accept as Solution" button on any posts that helped you resolve your problem or question.