Unlock a world of possibilities! Login now and discover the exclusive benefits awaiting you.
- Qlik Community
- :
- All Forums
- :
- QlikView App Dev
- :
- Re: How to filter list box values in chart
- Subscribe to RSS Feed
- Mark Topic as New
- Mark Topic as Read
- Float this Topic for Current User
- Bookmark
- Subscribe
- Mute
- Printer Friendly Page
- Mark as New
- Bookmark
- Subscribe
- Mute
- Subscribe to RSS Feed
- Permalink
- Report Inappropriate Content
How to filter list box values in chart
Hi ,
I have a chart as below :
A,B and C are the KPI's in which A is in Blue Color , B is in Yellow Color and C is in Red colour. I have a list box where there are Person names in that. When i click on any person name :
1)I should get only A and B i.e Blue and Yellow colors and not red color(I am able to accomplish this by using getselectedcount(person)=0 in the conditional statement of the C kpi )
2)When i click on "NLL" value in Person list box i must get only C value i.e only red colour .
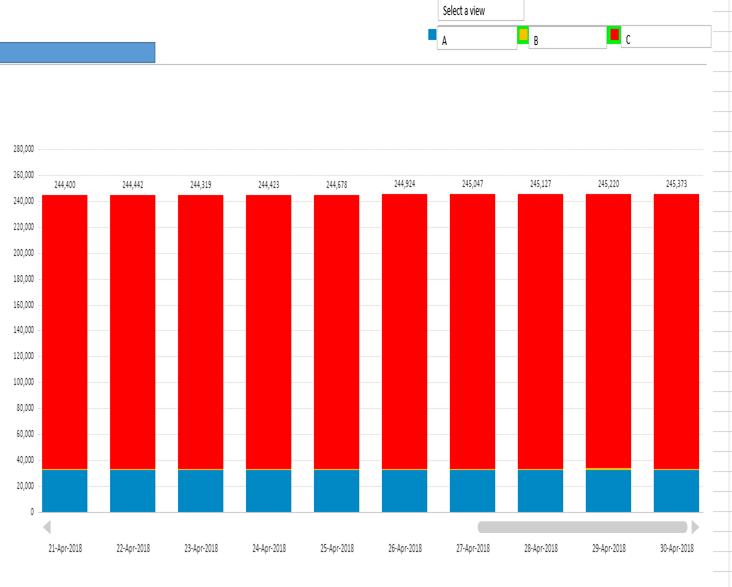
Am unable to get the 2nd condition mentioned above. Is it possible to filter for the values in the same list box multiple times ?
Pls let me know how to achieve this.
Thanks
Accepted Solutions
- Mark as New
- Bookmark
- Subscribe
- Mute
- Subscribe to RSS Feed
- Permalink
- Report Inappropriate Content
Maybe add a second condition to the red expression conditional:
=getselectedcount(person)=0 or Only(person) = 'NLL'
and also add conditional to the expression for blue and yellow:
=Only(person) <> 'NLL'
- Mark as New
- Bookmark
- Subscribe
- Mute
- Subscribe to RSS Feed
- Permalink
- Report Inappropriate Content
swuehl could you pls help on this
- Mark as New
- Bookmark
- Subscribe
- Mute
- Subscribe to RSS Feed
- Permalink
- Report Inappropriate Content
stalwar1 could you pls help out with the above query I have
- Mark as New
- Bookmark
- Subscribe
- Mute
- Subscribe to RSS Feed
- Permalink
- Report Inappropriate Content
Is there a qvw file you can share where we can see the set up you have?
- Mark as New
- Bookmark
- Subscribe
- Mute
- Subscribe to RSS Feed
- Permalink
- Report Inappropriate Content
Maybe add a second condition to the red expression conditional:
=getselectedcount(person)=0 or Only(person) = 'NLL'
and also add conditional to the expression for blue and yellow:
=Only(person) <> 'NLL'
- Mark as New
- Bookmark
- Subscribe
- Mute
- Subscribe to RSS Feed
- Permalink
- Report Inappropriate Content
thank you Stefan. It worked !