Unlock a world of possibilities! Login now and discover the exclusive benefits awaiting you.
- Qlik Community
- :
- All Forums
- :
- QlikView App Dev
- :
- How to generate the Sum of Receivable per year on ...
- Subscribe to RSS Feed
- Mark Topic as New
- Mark Topic as Read
- Float this Topic for Current User
- Bookmark
- Subscribe
- Mute
- Printer Friendly Page
- Mark as New
- Bookmark
- Subscribe
- Mute
- Subscribe to RSS Feed
- Permalink
- Report Inappropriate Content
How to generate the Sum of Receivable per year on chart?
Hi,
I'm having a trouble on how to display the Sum of Receivables per Year on chart.
Can someone explain me how to do it? Here is the data of my tables.
| Year | Baranggay Name | Baranggay Code | Recivables |
|---|---|---|---|
| 2009 | ALASAS | 2 | 1613488.7 |
| 2009 | ALASAS | 2 | 1613488.7 |
| 2009 | ALASAS | 2 | 1613488.7 |
| 2009 | ALASAS | 2 | 1613488.7 |
| 2009 | BALITI | 3 | 6568081.04 |
| 2009 | BALITI | 3 | 6568081.04 |
| 2009 | BALITI | 3 | 6568081.04 |
| 2010 | BALITI | 3 | 6568081.04 |
| 2010 | BULAON | 4 | 2033106.82 |
| 2010 | BULAON | 4 | 2033106.82 |
| 2010 | BULAON | 4 | 2033106.82 |
| 2010 | BULAON | 4 | 2033106.82 |
| 2010 | CALULUT | 5 | 4265549.02 |
| 2010 | CALULUT | 5 | 4265549.02 |
| 2010 | CALULUT | 5 | 4265549.02 |
| 2011 | CALULUT | 5 | 4265549.02 |
| 2011 | DEL CARMEN | 8 | 6188425.28 |
Thanks in advance
Accepted Solutions
- Mark as New
- Bookmark
- Subscribe
- Mute
- Subscribe to RSS Feed
- Permalink
- Report Inappropriate Content
- Mark as New
- Bookmark
- Subscribe
- Mute
- Subscribe to RSS Feed
- Permalink
- Report Inappropriate Content
Hello!
sum(Receivables)/count(distinct Year)
- Mark as New
- Bookmark
- Subscribe
- Mute
- Subscribe to RSS Feed
- Permalink
- Report Inappropriate Content
Not sure what your desired output is. Would you be able to explain a little bit more?
Best,
Sunny
- Mark as New
- Bookmark
- Subscribe
- Mute
- Subscribe to RSS Feed
- Permalink
- Report Inappropriate Content
I want to display the total sum of receivable per year on the chart using the table i posted.
- Mark as New
- Bookmark
- Subscribe
- Mute
- Subscribe to RSS Feed
- Permalink
- Report Inappropriate Content
thank for the help, I will try it later.
- Mark as New
- Bookmark
- Subscribe
- Mute
- Subscribe to RSS Feed
- Permalink
- Report Inappropriate Content
Are you looking for one of the two outputs from the below attached image?
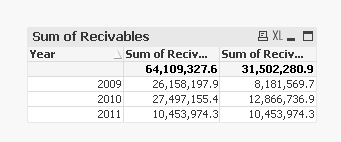
Dimension: Year
Expression 1: =Sum(Recivables)
Expression 2: =Sum(Aggr(Avg(Recivables), Year, [Baranggay Code]))
Also attaching the qvw document for your reference.
HTH
Best,
Sunny