Unlock a world of possibilities! Login now and discover the exclusive benefits awaiting you.
- Qlik Community
- :
- All Forums
- :
- QlikView App Dev
- :
- Re: How to get set analysis to work using multiple...
- Subscribe to RSS Feed
- Mark Topic as New
- Mark Topic as Read
- Float this Topic for Current User
- Bookmark
- Subscribe
- Mute
- Printer Friendly Page
- Mark as New
- Bookmark
- Subscribe
- Mute
- Subscribe to RSS Feed
- Permalink
- Report Inappropriate Content
How to get set analysis to work using multiple bi-dimension conditions in a pivot table
The following question relates to set analysis, using a combination of conditions based on equating 2 dimensions.
Please see the attached screen-captures & QV file.
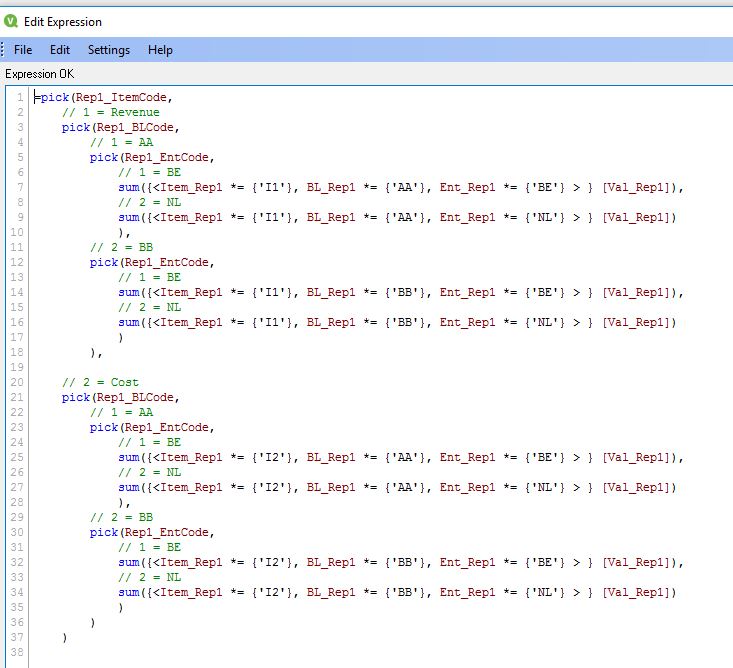
I can solve the problem with an elaborate formula for calculating an expression (see WorkingElaborateFormula.JPG and lower here), but as the possible values for dimensions (and number of dimensions) increase, this solution is not sustainable.
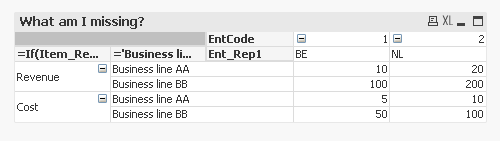
To illustrate what I cannot get to work, I have created a simple example of the data (see Script.JPG) & pivottable (see OutputView.JPG) . There must be a 'simple' solution to this, but so far it eludes me...
What I want to do is to change this (working) formula:
=pick(Rep1_ItemCode,
// 1 = Revenue
pick(Rep1_BLCode,
// 1 = AA
pick(Rep1_EntCode,
// 1 = BE
sum({<Item_Rep1 *= {'I1'}, BL_Rep1 *= {'AA'}, Ent_Rep1 *= {'BE'} > } [Val_Rep1]),
// 2 = NL
sum({<Item_Rep1 *= {'I1'}, BL_Rep1 *= {'AA'}, Ent_Rep1 *= {'NL'} > } [Val_Rep1])
),
// 2 = BB
pick(Rep1_EntCode,
// 1 = BE
sum({<Item_Rep1 *= {'I1'}, BL_Rep1 *= {'BB'}, Ent_Rep1 *= {'BE'} > } [Val_Rep1]),
// 2 = NL
sum({<Item_Rep1 *= {'I1'}, BL_Rep1 *= {'BB'}, Ent_Rep1 *= {'NL'} > } [Val_Rep1])
)
),
// 2 = Cost
pick(Rep1_BLCode,
// 1 = AA
pick(Rep1_EntCode,
// 1 = BE
sum({<Item_Rep1 *= {'I2'}, BL_Rep1 *= {'AA'}, Ent_Rep1 *= {'BE'} > } [Val_Rep1]),
// 2 = NL
sum({<Item_Rep1 *= {'I2'}, BL_Rep1 *= {'AA'}, Ent_Rep1 *= {'NL'} > } [Val_Rep1])
),
// 2 = BB
pick(Rep1_EntCode,
// 1 = BE
sum({<Item_Rep1 *= {'I2'}, BL_Rep1 *= {'BB'}, Ent_Rep1 *= {'BE'} > } [Val_Rep1]),
// 2 = NL
sum({<Item_Rep1 *= {'I2'}, BL_Rep1 *= {'BB'}, Ent_Rep1 *= {'NL'} > } [Val_Rep1])
)
)
)
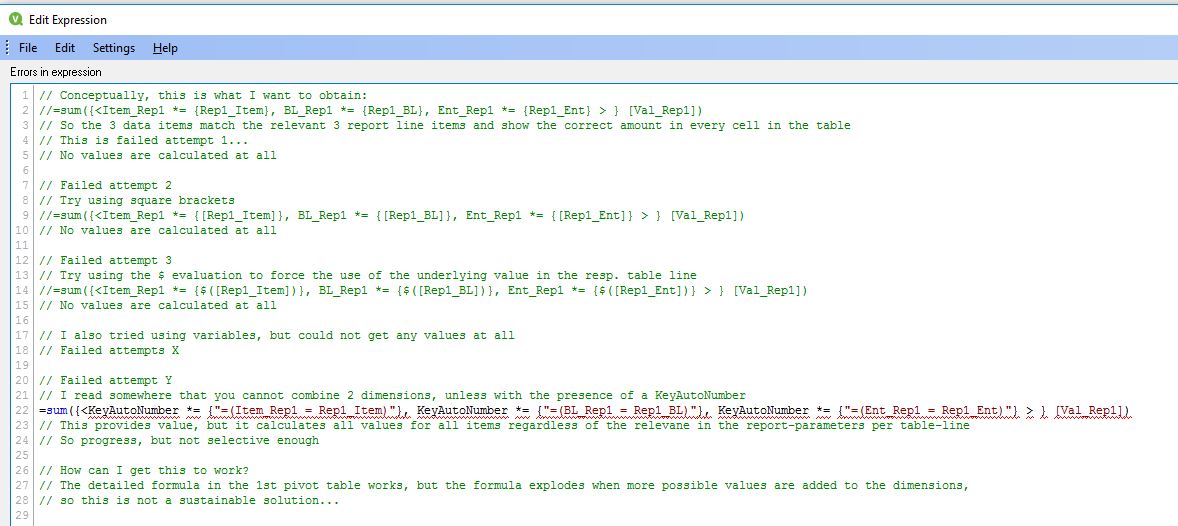
to something as easy as (conceptually):
=sum({<Item_Rep1 *= {Rep1_Item}, BL_Rep1 *= {Rep1_BL}, Ent_Rep1 *= {Rep1_Ent} > } [Val_Rep1])
So the 3 data items match the relevant 3 report line items and show the correct amount in every cell in the pivot table
My failed attampts can be found in FailedFormulas.JPG.
The closest I get to something that actually produces values in the pivot table is this:
=sum({<KeyAutoNumber *= {"=(Item_Rep1 = Rep1_Item)"}, KeyAutoNumber *= {"=(BL_Rep1 = Rep1_BL)"}, KeyAutoNumber *= {"=(Ent_Rep1 = Rep1_Ent)"} > } [Val_Rep1])
This provides values, but it calculates all values for all items regardless of the relevance in the report-parameters per table-line
So progress, but not selective enough.
Thanks for any help to get this simple formula to work.
Bart
- Mark as New
- Bookmark
- Subscribe
- Mute
- Subscribe to RSS Feed
- Permalink
- Report Inappropriate Content
Hi Bart,
I'm not sure I understand your question entirely.
If your goal is to recreate the picture in Rep1-Correct, I believe I've done so entirly without resorting to set analysis.
I have attached an example. Please see if this is of any help. Otherwise, maybe you can try and further explain your goals.
With kind regards,
Ronald
- Mark as New
- Bookmark
- Subscribe
- Mute
- Subscribe to RSS Feed
- Permalink
- Report Inappropriate Content
Thanks, Ronald.
The example presented is a very simple 'extract' of a more complex report setup. I need a set-analysis solution, and the only way to make the expression formula scalable and manageable with more dimensions is to make it work as can be seen below (conceptually):
=sum({<Item_Rep1 *= {Rep1_Item}, BL_Rep1 *= {Rep1_BL}, Ent_Rep1 *= {Rep1_Ent} > } [Val_Rep1])
So the 3 data items match the relevant 3 report line items and show the correct amount in every cell in the pivot table.
My question is: how can I get the above mentioned conceptual set analysis formula to work e.g. can QlikView set analysis work with bi-dimensional conditions, and how do I need to define them to get the desired result in my example?
Thanks.
- Mark as New
- Bookmark
- Subscribe
- Mute
- Subscribe to RSS Feed
- Permalink
- Report Inappropriate Content
Please let me describe in another way what I want to achieve (assuming this is possible):
- the dimensions used in the Pivot table cannot contain references to the data fields; so only the report structure fields can be used
- the link between the data fields and the report fiels can only happen in the Pivot table expression.
Thanks.
- Mark as New
- Bookmark
- Subscribe
- Mute
- Subscribe to RSS Feed
- Permalink
- Report Inappropriate Content
not quite sure, whether it works in pivot-tables, but used to load the headers as DUAL-values into an island-table.
This field then is the dimension.
Calculation works with PICK .... 1 refers then to the first dimension, 2 to the second etc.
For each column you will then have to change your calculation (i.e. differentiation by country).
As a result basically each cell in your table will follow its own calculation.
Peter
- Mark as New
- Bookmark
- Subscribe
- Mute
- Subscribe to RSS Feed
- Permalink
- Report Inappropriate Content
Thanks, Peter. I have to investigate this approach as I'm not yet familiar with it; will come back to you later.
- Mark as New
- Bookmark
- Subscribe
- Mute
- Subscribe to RSS Feed
- Permalink
- Report Inappropriate Content
I've looked into this option, and although it would work with a static report, it is not well suited for my needs: it still has an elaborate pick in the calc, it does not scale automatically, and in essence it defines the report setup in the dimensions, and not via a report-structure-table (which is easier to maintain). But still a useful approach for another case. Thanks.