Unlock a world of possibilities! Login now and discover the exclusive benefits awaiting you.
- Qlik Community
- :
- All Forums
- :
- QlikView App Dev
- :
- Re: How to get stacked type in a combo chart?
- Subscribe to RSS Feed
- Mark Topic as New
- Mark Topic as Read
- Float this Topic for Current User
- Bookmark
- Subscribe
- Mute
- Printer Friendly Page
- Mark as New
- Bookmark
- Subscribe
- Mute
- Subscribe to RSS Feed
- Permalink
- Report Inappropriate Content
How to get stacked type in a combo chart?
How to get stacked type in a combo chart?

I have two fields, 1. Cluster(group of states), 2. Country. i want country in dimension and cluster in expression in stacked format. and the total should show in line at top. I need help to achieve this.
- « Previous Replies
-
- 1
- 2
- Next Replies »
- Mark as New
- Bookmark
- Subscribe
- Mute
- Subscribe to RSS Feed
- Permalink
- Report Inappropriate Content
Add an expression for each cluster with Bar as type.
talk is cheap, supply exceeds demand
- Mark as New
- Bookmark
- Subscribe
- Mute
- Subscribe to RSS Feed
- Permalink
- Report Inappropriate Content
It looks like hard coding, but i would like to have it dynamically added.
- Mark as New
- Bookmark
- Subscribe
- Mute
- Subscribe to RSS Feed
- Permalink
- Report Inappropriate Content
Please share some sample data if possible.
- Mark as New
- Bookmark
- Subscribe
- Mute
- Subscribe to RSS Feed
- Permalink
- Report Inappropriate Content
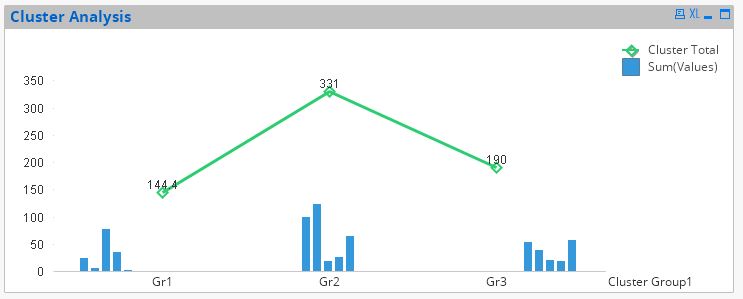
I have attached an example as requested. I need the dashboard similar to the attachment along with the line having total. and Line should not change based on the selection.
- Mark as New
- Bookmark
- Subscribe
- Mute
- Subscribe to RSS Feed
- Permalink
- Report Inappropriate Content
Attached sample file
- Mark as New
- Bookmark
- Subscribe
- Mute
- Subscribe to RSS Feed
- Permalink
- Report Inappropriate Content
I have attached the file...
- Mark as New
- Bookmark
- Subscribe
- Mute
- Subscribe to RSS Feed
- Permalink
- Report Inappropriate Content
Prabhu,
You want to same in Qlikview?
- Mark as New
- Bookmark
- Subscribe
- Mute
- Subscribe to RSS Feed
- Permalink
- Report Inappropriate Content
Yes, in addition with a line at top having total and the line should not change based on the cluster group
- Mark as New
- Bookmark
- Subscribe
- Mute
- Subscribe to RSS Feed
- Permalink
- Report Inappropriate Content
It looks kind of not possible in Qlikview in direct way caz when we try to plot line chart where individual totals are cluster totals, they cannot be plotted against the overall dimension of the chart which are both cluster group and country.
When I tried to use Aggr by cluster, Qlikview stopped showing me stacked option in style tab. I could achieve the attached one only so far.
- « Previous Replies
-
- 1
- 2
- Next Replies »