Unlock a world of possibilities! Login now and discover the exclusive benefits awaiting you.
- Qlik Community
- :
- All Forums
- :
- QlikView App Dev
- :
- How to make some of the expression’s labels bold ...
- Subscribe to RSS Feed
- Mark Topic as New
- Mark Topic as Read
- Float this Topic for Current User
- Bookmark
- Subscribe
- Mute
- Printer Friendly Page
- Mark as New
- Bookmark
- Subscribe
- Mute
- Subscribe to RSS Feed
- Permalink
- Report Inappropriate Content
How to make some of the expression’s labels bold in a straight table
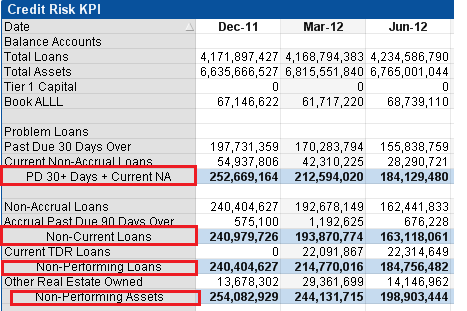
I have some totals as expressions in a straight table, to differentiate this totals from the rest of the expressions I would like the title to be bold. In the attached image, I would like for the expressions encircled in red to show in bold. Any ideas? It seems that all the lables have the same Font formatting.
- Mark as New
- Bookmark
- Subscribe
- Mute
- Subscribe to RSS Feed
- Permalink
- Report Inappropriate Content
Add a new expression: dimensionality(). This will show you the various dimensionsionalities in your table. Notice the dimensionality of your chosen text. Then go into your chosen expression, that you want to be bold, and go into its text color properties by clicking on the expand button next to it, under that you will see text color, choose that).
Type in: if(dimensionality()=0(or whatever for your table),'<B>').
Then you are done.
Let me know if you have any problems!
Br,
T
- Mark as New
- Bookmark
- Subscribe
- Mute
- Subscribe to RSS Feed
- Permalink
- Report Inappropriate Content
Dimensions tab --> YourDimension --> text format
if(match(YourDimension, 'Non-Current Loans', 'Non-PerformingLoans', 'No-Performing Assets'), '<B>')
better to use some ad hoc field in your model to define the dimension text format , text color, etc....
- Mark as New
- Bookmark
- Subscribe
- Mute
- Subscribe to RSS Feed
- Permalink
- Report Inappropriate Content
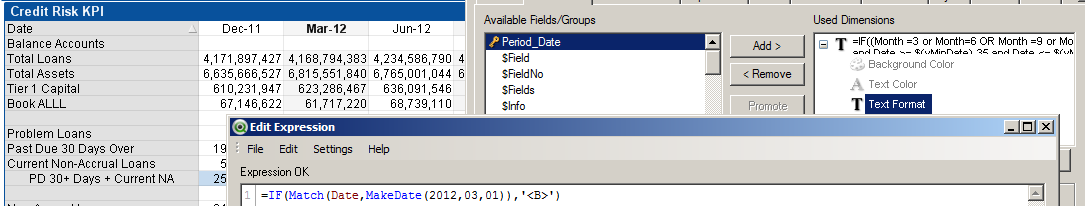
Tried Tibor approach but can't make it work. Dimensionality returned 1, I tried the formula as suggested in both "Text Color" and "Text Format"but the label does not bold.

Regarding Massimo's approach, I forgot to mention this is a Horizontal table, therefore the expressions are the rows titles and the dates are the columns. Massimo's approach works to bold specific dates.
I want the "PD 30+ Days + Current NA" to show bold.