Unlock a world of possibilities! Login now and discover the exclusive benefits awaiting you.
- Qlik Community
- :
- All Forums
- :
- QlikView App Dev
- :
- How to show ALL Plot Values on Stacked Bar Chart
- Subscribe to RSS Feed
- Mark Topic as New
- Mark Topic as Read
- Float this Topic for Current User
- Bookmark
- Subscribe
- Mute
- Printer Friendly Page
- Mark as New
- Bookmark
- Subscribe
- Mute
- Subscribe to RSS Feed
- Permalink
- Report Inappropriate Content
How to show ALL Plot Values on Stacked Bar Chart
Hi,
I have a stacked bar chart with Plot Values in the segments, however, in the smallest segments, I can't get ALL the values to be there, here a screenshot:
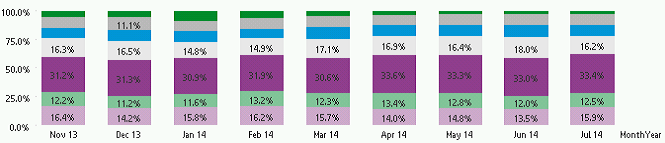
I've noticed that the segments without Plot Values have values under 10%, Could this be the reason?
I have selected the options 'Values on Data Points' on the Expressions Tab and 'Plot Values Inside Segments' on Presentation Tab.
Any help would be really appreciated, thanks!
Regards,
Omar L.
- Mark as New
- Bookmark
- Subscribe
- Mute
- Subscribe to RSS Feed
- Permalink
- Report Inappropriate Content
Hi Omar,
Did you try enable the relative checkbox in the expression tab?
Regards
Velan
- Mark as New
- Bookmark
- Subscribe
- Mute
- Subscribe to RSS Feed
- Permalink
- Report Inappropriate Content
Hi Velan, I didn't but after you mentioned it, didn't work either, and the numbers got weird:
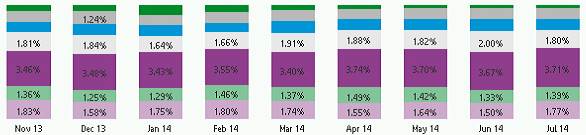
Thanks for the help!
Regards,
Omar L.
- Mark as New
- Bookmark
- Subscribe
- Mute
- Subscribe to RSS Feed
- Permalink
- Report Inappropriate Content
I'm also looking for the same solution. Have you got it anyway?
- Mark as New
- Bookmark
- Subscribe
- Mute
- Subscribe to RSS Feed
- Permalink
- Report Inappropriate Content
I have been trying hard to also solve this; I know the bar might not be big enough but the data needs to be displayed so you should be able to force it in.
you can show values for all if you switch to a line graph; but then you lose the total showing.
if anyone has resolved this I will switch back to bar  ...
...