Unlock a world of possibilities! Login now and discover the exclusive benefits awaiting you.
- Qlik Community
- :
- All Forums
- :
- QlikView App Dev
- :
- I could not see values on data points in Gauge cha...
- Subscribe to RSS Feed
- Mark Topic as New
- Mark Topic as Read
- Float this Topic for Current User
- Bookmark
- Subscribe
- Mute
- Printer Friendly Page
- Mark as New
- Bookmark
- Subscribe
- Mute
- Subscribe to RSS Feed
- Permalink
- Report Inappropriate Content
I could not see values on data points in Gauge chart
Hi All,
I could not see values on gauge chart.
Expression is sum(my field).
Below are values to show on chart
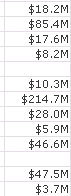

Thanks all
- Mark as New
- Bookmark
- Subscribe
- Mute
- Subscribe to RSS Feed
- Permalink
- Report Inappropriate Content
I got it , 
But i cant see other 4 values on the data points. any thing in properties to adjust? i want to show the value when selected as popup or on the charts..
Thanks
- Mark as New
- Bookmark
- Subscribe
- Mute
- Subscribe to RSS Feed
- Permalink
- Report Inappropriate Content
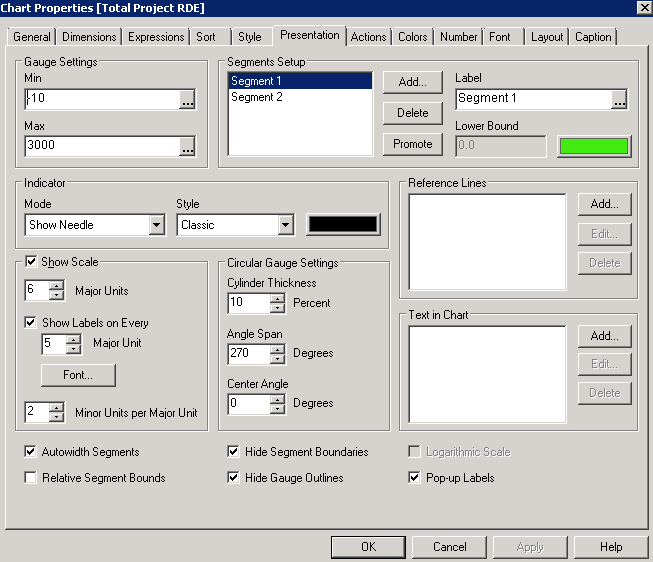
The gauge chart doesn't have a Values on Data Points option. You will have to use the Text in Chart option on the Presentation tab. Use as value for the text option the expression of your chart: sum([my field]). Once you've added the text object you can move it by pressing the ctrl+shift keys at the same time. You will see red outlines of parts of the chart. You can use the mouse to resize and move these outlined boxes.
talk is cheap, supply exceeds demand
- Mark as New
- Bookmark
- Subscribe
- Mute
- Subscribe to RSS Feed
- Permalink
- Report Inappropriate Content
Can you upload sample qvw?