Unlock a world of possibilities! Login now and discover the exclusive benefits awaiting you.
- Qlik Community
- :
- All Forums
- :
- QlikView App Dev
- :
- I'm having trouble displaying my report.
- Subscribe to RSS Feed
- Mark Topic as New
- Mark Topic as Read
- Float this Topic for Current User
- Bookmark
- Subscribe
- Mute
- Printer Friendly Page
- Mark as New
- Bookmark
- Subscribe
- Mute
- Subscribe to RSS Feed
- Permalink
- Report Inappropriate Content
I'm having trouble displaying my report.
Hello,
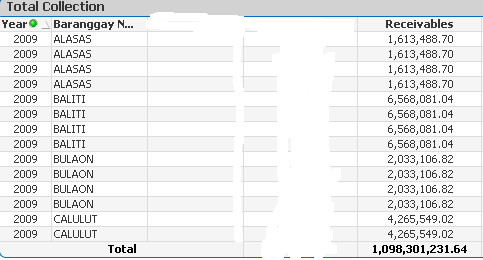
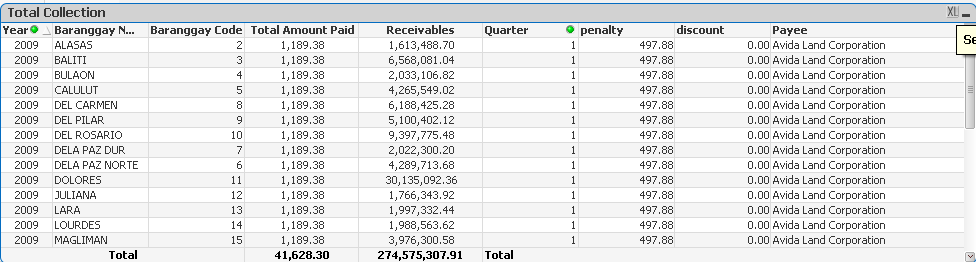
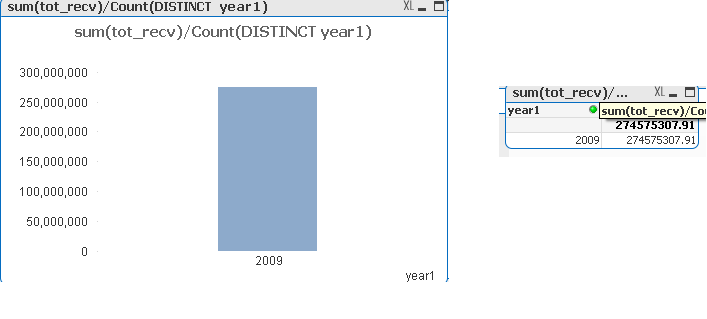
My Receivables on Year 2009 is 1,098,301,231.64 and my Receivable per quarter is 274,575307.91, every time i make a chart it always display my Quarterly Receivable.
Can you help me to display the 1,098,301,231.64 Receivable on the chart?
Please Help me on my project.
Here is my some photo attached
- Mark as New
- Bookmark
- Subscribe
- Mute
- Subscribe to RSS Feed
- Permalink
- Report Inappropriate Content
Well, that's hard to answer with the information provided (i.e. lacking information about the data model, chart dimensions, expressions etc.).
Please double check that you don't have any selections in field Quarter when you are creating a chart with dimension Year, since the selections will affect the data aggregated in every chart (this is QV default behaviour).
You can clear selections in expression evaluation using set analysis, maybe this is the case in other charts you are looking at.
Anyway, without knowing more details about your settings, I think it's just wild guessing.
- Mark as New
- Bookmark
- Subscribe
- Mute
- Subscribe to RSS Feed
- Permalink
- Report Inappropriate Content
sir I just forgot to add the Aggr() function. I already get the correct answer.
btw Thanks for sharing your idea 