Unlock a world of possibilities! Login now and discover the exclusive benefits awaiting you.
- Qlik Community
- :
- All Forums
- :
- QlikView App Dev
- :
- Ignore and Hide a dimension in Chart expression
- Subscribe to RSS Feed
- Mark Topic as New
- Mark Topic as Read
- Float this Topic for Current User
- Bookmark
- Subscribe
- Mute
- Printer Friendly Page
- Mark as New
- Bookmark
- Subscribe
- Mute
- Subscribe to RSS Feed
- Permalink
- Report Inappropriate Content
Ignore and Hide a dimension in Chart expression
Hi everybody,
I have been trawling through so many threads and cannot find anything that will work for me, hoping someone will be able to help.
I have a Combo Chart with 2 dimensions: Litigation_Date and Close_Date. In my expression I am calculating rates as a %. To give a bit of context the numerator will count the number of IDs with a Litigation_Date, and the denominator will count the number of IDs with a Close Date (per year, month etc.) The user will be able to filter by Litigation_Date and so this is the primary dimension in my chart. It is possible to have IDs with a Litigation_Date, but no Close_Date, and vice versa.
I have tried using the TOTAL function for the numerator and this appears to work, counting only IDs with a Litigation_Date:
COUNT(TOTAL<Litigation_Date> DISTINCT ID)
This does not work for the denominator though:
COUNT(TOTAL <Close_Date> DISTINCT ID) --> this returns only IDs with a Close_Date AND a Litigation_Date.
Any help would be greatly appreciated.
- Mark as New
- Bookmark
- Subscribe
- Mute
- Subscribe to RSS Feed
- Permalink
- Report Inappropriate Content
Can you share a sample app with some expected output. Try this may be:
= Count(TOTAL {< ID = E(Close_Date) >} DISTINCT ID)
- Mark as New
- Bookmark
- Subscribe
- Mute
- Subscribe to RSS Feed
- Permalink
- Report Inappropriate Content
Sorry, I don't have access to the internet on the server holding QV.
In table form when I use the above as my denominator I get the following: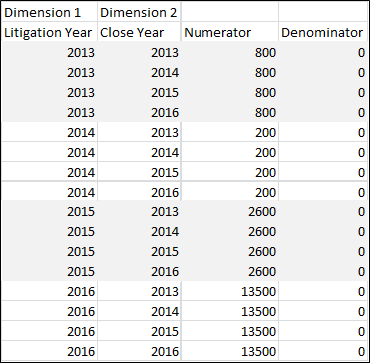
What I need is something like this:

Where the denominator is the count of all cases with a Close Year in 2013, 2014 etc. and where you do not see the Close Year in the chart, but it is used as a dimension (only needed to calculate denominator).
I'm not sure if this is possible but thanks for your help.
- Mark as New
- Bookmark
- Subscribe
- Mute
- Subscribe to RSS Feed
- Permalink
- Report Inappropriate Content
I quite did not get you? Can you elaborate a little please. How would you get the denominator values as 7800 for 2013 for eg? Can you load some sample data on to excel and upload here?
- Mark as New
- Bookmark
- Subscribe
- Mute
- Subscribe to RSS Feed
- Permalink
- Report Inappropriate Content
That's what the denominator value should be. But I'm finding it difficult to get that value in QV.
LitigationYear is my Top most dimension, followed by CloseYear. Not every ID has a LitigationYear and not every ID has a CloseYear.
My numerator should count everything per LitigationYear and my denominator should count everything per CloseYear. But in QV I cannot get the denominator to calculate correctly - at best it will only count IDs that do have a LitigationYear, and excludes those that don't (as LitigationYear is the top most dimension).
I'm sorry I can't attach any data right now.
- Mark as New
- Bookmark
- Subscribe
- Mute
- Subscribe to RSS Feed
- Permalink
- Report Inappropriate Content
What are the expressions you are using for Numerator and Denominator. Its kind of tough to work on something which i dont have. Can you create some dummy data out of your original data. Like atleast few rows that has ID's for Litigation and no ID's for Close year.?