Unlock a world of possibilities! Login now and discover the exclusive benefits awaiting you.
- Qlik Community
- :
- All Forums
- :
- QlikView App Dev
- :
- In compound chart (multiple lines+bars), how to ge...
- Subscribe to RSS Feed
- Mark Topic as New
- Mark Topic as Read
- Float this Topic for Current User
- Bookmark
- Subscribe
- Mute
- Printer Friendly Page
- Mark as New
- Bookmark
- Subscribe
- Mute
- Subscribe to RSS Feed
- Permalink
- Report Inappropriate Content
In compound chart (multiple lines+bars), how to get bars to group and NOT stack
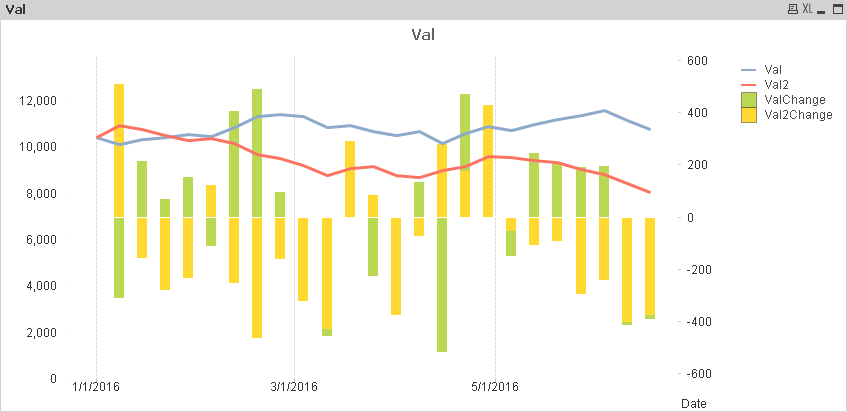
I have a Qlikview chart (sample attached) with 1 date dimension and 2 pairs of expressions (for a total of 4 expressions). For each pair of expressions, the first expression is a value and the second expression is the change in value from the previous period. The first expression is shown as a line; the second as a bar. Since there are two pairs of these expressions, the chart has 2 lines and 2 sets of bars. The problem is that the bars should be grouped, not stacked. In the chart properties, I've selected the "Grouped" radio button in the Style tab. Curiously, when I select only 1 date, the two bars are not grouped, but rendered as two separate bars, each zero-based, as they should be. (I'm using QV 11.20 SR12.)
Does anyone know what I'm doing wrong? Thanks in advance...
Accepted Solutions
- Mark as New
- Bookmark
- Subscribe
- Mute
- Subscribe to RSS Feed
- Permalink
- Report Inappropriate Content
Remove Continuous from Axes tab of chart properties and uncheck continuous option in Dimension axis and see if it works?
Thanks,
V.
- Mark as New
- Bookmark
- Subscribe
- Mute
- Subscribe to RSS Feed
- Permalink
- Report Inappropriate Content
Remove Continuous from Axes tab of chart properties and uncheck continuous option in Dimension axis and see if it works?
Thanks,
V.
- Mark as New
- Bookmark
- Subscribe
- Mute
- Subscribe to RSS Feed
- Permalink
- Report Inappropriate Content
SImply unchecking the "Continuous" checkbox in the Axes tab, fixed the bug. Thank you!!
- Mark as New
- Bookmark
- Subscribe
- Mute
- Subscribe to RSS Feed
- Permalink
- Report Inappropriate Content
Oh Good, I am glad it worked for you.