Unlock a world of possibilities! Login now and discover the exclusive benefits awaiting you.
- Qlik Community
- :
- All Forums
- :
- QlikView App Dev
- :
- Re: Incorrect stacked chart calculation in Sense
- Subscribe to RSS Feed
- Mark Topic as New
- Mark Topic as Read
- Float this Topic for Current User
- Bookmark
- Subscribe
- Mute
- Printer Friendly Page
- Mark as New
- Bookmark
- Subscribe
- Mute
- Subscribe to RSS Feed
- Permalink
- Report Inappropriate Content
Incorrect stacked chart calculation in Sense
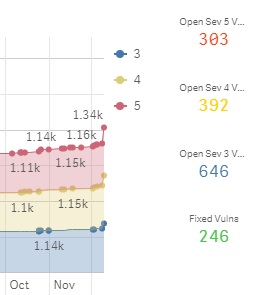
I'm trying to show the breakdown of a count of vulnerabilities by severity. Severities are either 3,4 or 5. The chart is done by time on the X axis against count of vulnerabilities on the Y.
My issue is that although the total number of vulnerabilities is correct (1,346) the split in the chart is not. See the graphic below. The chart shows them roughly equally split but the totals to the side are the real values and show a different split. Blues are Severity 3, Yellow 4 and Red 5.
The measure I'm using has the following calculation:
RANGESUM(ABOVE(TOTAL Count(Severity),0, ROWNO(TOTAL)))
Can anyone suggest how to correct the split in this calculation please ?
Thanks
- « Previous Replies
- Next Replies »
- Mark as New
- Bookmark
- Subscribe
- Mute
- Subscribe to RSS Feed
- Permalink
- Report Inappropriate Content
May be you need this
Aggr(RangeSum(Above(Count(Severity), 0, RowNo())), Severity, Month)
- Mark as New
- Bookmark
- Subscribe
- Mute
- Subscribe to RSS Feed
- Permalink
- Report Inappropriate Content
Hi Sunny,
I'm afraid that removes all plots. I think it's because I'm not tracking by month, but from a datetime string included with every value. Each line in the source has a field called (First Found Datetime) in the format "2017-09-13T08:56:29Z". I use this as a dimension, along with Severity (integer 3, 4 or 5). I've played with the idea of aggregation but not come up with the fix yet.
Damian
- Mark as New
- Bookmark
- Subscribe
- Mute
- Subscribe to RSS Feed
- Permalink
- Report Inappropriate Content
Did this also not work?
Aggr(RangeSum(Above(Count(Severity), 0, RowNo())), Severity, datetime)
- Mark as New
- Bookmark
- Subscribe
- Mute
- Subscribe to RSS Feed
- Permalink
- Report Inappropriate Content
Yes with a tweak. I had to enclose the last field in quotes.
Aggr(RangeSum(Above(Count(Severity), 0, RowNo())), Severity, "First Found Datetime")
Thanks very much Sunny
- Mark as New
- Bookmark
- Subscribe
- Mute
- Subscribe to RSS Feed
- Permalink
- Report Inappropriate Content
Sure, and that is because there are spaces, but the logic still stays the same that you needed to use Aggr() function first by Severity and then your date and time field...
Please close the thread if you got what you wanted by marking correct and helpful responses.
Qlik Community Tip: Marking Replies as Correct or Helpful
Best,
Sunny
- Mark as New
- Bookmark
- Subscribe
- Mute
- Subscribe to RSS Feed
- Permalink
- Report Inappropriate Content
Will do.
I hit another problem though now that this one is cleared (couldn't see it before).
All data lines are of status New, Open, Fixed or Re-opened. I've been treating all as adding to the total, which is incorrect. The Fixed status ones need removing from the relevant total of either 3, 4 or 5 severity depending on which that Fixed issue was.
The data is a historic snapshot of what happened.
For example:
It shows 3x Severity 5 vulnerabilities with "First Found Datetime" of 01JAN17 and no "Last Found Datetime" (there is no data in the CSV field for "Last Fixed Datetime"). So those vulnerabilities are all still active (no Fixed date).
It shows another Severity 5 vulnerability "First Found Datetime" of 01JAN17 but that line has a "Last Found Datetime" of 12JAN17. So this one is now Fixed but should show only from 01JAN17 to 12JAN17. After that is no longer an issue.
Is my description understandable ?
I appreciate your help with this Sunny.
- Mark as New
- Bookmark
- Subscribe
- Mute
- Subscribe to RSS Feed
- Permalink
- Report Inappropriate Content
Unfortunately, I don't complete follow... would you be able to share few rows of raw data to explain what exactly are you looking to get from it?
- Mark as New
- Bookmark
- Subscribe
- Mute
- Subscribe to RSS Feed
- Permalink
- Report Inappropriate Content
Yes - lines in CSV format below. I can't see how to attach the whole file.
Host ID,IP Address,Tracking Method,Operating System,DNS Name,Netbios Name,QG HostID,Last Scan Datetime,OS CPE,Last VM Scanned Date,Last VM Scanned Duration,Last VM Auth Scanned Date,Last VM Auth Scanned Duration,Last PC Scanned Date,QID,Type,Port,Protocol,FQDN,SSL,Instance,Status,Severity,First Found Datetime,Last Found Datetime,Last Test Datetime,Last Update Datetime,Last Fixed Datetime,Results,Ignored,Disabled,Times Found,Service,Last Processed Datetime
107355502,192.168.100.71,AGENT,Microsoft Windows 10 Home 10.0.15063 N/A Build 15063,dell-13,DELL-13,f223930d-80cc-4cd8-8849-52341d5af8d5,2017-12-05T01:21:34Z,,2017-12-05T01:20:59Z,,2017-12-05T01:20:59Z,,2017-12-04T11:06:11Z,90042,Potential,,,,0,,Active,3,2017-04-05T19:01:52Z,2017-12-05T01:20:59Z,2017-12-05T01:20:59Z,2017-12-05T01:21:34Z,,,0,0,69,,2017-12-05T01:21:34Z
107355502,192.168.100.71,AGENT,Microsoft Windows 10 Home 10.0.15063 N/A Build 15063,dell-13,DELL-13,f223930d-80cc-4cd8-8849-52341d5af8d5,2017-12-05T01:21:34Z,,2017-12-05T01:20:59Z,,2017-12-05T01:20:59Z,,2017-12-04T11:06:11Z,90126,Potential,,,,0,,Fixed,3,2017-04-11T11:14:12Z,2017-10-24T18:50:15Z,2017-12-05T01:20:59Z,2017-12-05T01:21:34Z,2017-12-04T11:06:11Z,,0,0,49,,2017-12-05T01:21:34Z
107355502,192.168.100.71,AGENT,Microsoft Windows 10 Home 10.0.15063 N/A Build 15063,dell-13,DELL-13,f223930d-80cc-4cd8-8849-52341d5af8d5,2017-12-05T01:21:34Z,,2017-12-05T01:20:59Z,,2017-12-05T01:20:59Z,,2017-12-04T11:06:11Z,91340,Confirmed,,,,0,,Fixed,4,2017-04-05T19:01:52Z,2017-04-05T20:30:21Z,2017-12-05T01:20:59Z,2017-12-05T01:21:34Z,2017-04-07T19:33:15Z,,0,0,2,,2017-12-05T01:21:34Z
107355502,192.168.100.71,AGENT,Microsoft Windows 10 Home 10.0.15063 N/A Build 15063,dell-13,DELL-13,f223930d-80cc-4cd8-8849-52341d5af8d5,2017-12-05T01:21:34Z,,2017-12-05T01:20:59Z,,2017-12-05T01:20:59Z,,2017-12-04T11:06:11Z,91353,Confirmed,,,,0,,Fixed,5,2017-04-12T19:18:34Z,2017-08-03T18:02:57Z,2017-12-05T01:20:59Z,2017-12-05T01:21:34Z,2017-08-04T13:36:26Z,,0,0,3,,2017-12-05T01:21:34Z
107355502,192.168.100.71,AGENT,Microsoft Windows 10 Home 10.0.15063 N/A Build 15063,dell-13,DELL-13,f223930d-80cc-4cd8-8849-52341d5af8d5,2017-12-05T01:21:34Z,,2017-12-05T01:20:59Z,,2017-12-05T01:20:59Z,,2017-12-04T11:06:11Z,91409,Confirmed,,,,0,,Active,5,2017-09-18T14:57:23Z,2017-12-05T01:20:59Z,2017-12-05T01:20:59Z,2017-12-05T01:21:34Z,,,0,0,5,,2017-12-05T01:21:34Z
107355502,192.168.100.71,AGENT,Microsoft Windows 10 Home 10.0.15063 N/A Build 15063,dell-13,DELL-13,f223930d-80cc-4cd8-8849-52341d5af8d5,2017-12-05T01:21:34Z,,2017-12-05T01:20:59Z,,2017-12-05T01:20:59Z,,2017-12-04T11:06:11Z,91410,Confirmed,,,,0,,Fixed,5,2017-09-18T14:57:23Z,2017-09-18T14:57:23Z,2017-12-05T01:20:59Z,2017-12-05T01:21:34Z,2017-10-11T15:08:45Z,,0,0,1,,2017-12-05T01:21:34Z
107355502,192.168.100.71,AGENT,Microsoft Windows 10 Home 10.0.15063 N/A Build 15063,dell-13,DELL-13,f223930d-80cc-4cd8-8849-52341d5af8d5,2017-12-05T01:21:34Z,,2017-12-05T01:20:59Z,,2017-12-05T01:20:59Z,,2017-12-04T11:06:11Z,91413,Confirmed,,,,0,,New,5,2017-12-05T01:20:59Z,2017-12-05T01:20:59Z,2017-12-05T01:20:59Z,2017-12-05T01:21:34Z,,,0,0,1,,2017-12-05T01:21:34Z
All lines that are in this file need to show in the line chart but the ones which have status fixed need to stop showing in the chart from that fixed date/time.
For example, new issues are found over time and the chart shows a steady increase in volume of issues. If then there is a patch blitz and many issues are fixed on the same day those issues shouldn't disappear from the whole chart. instead they should show until the date they were patched.
- Mark as New
- Bookmark
- Subscribe
- Mute
- Subscribe to RSS Feed
- Permalink
- Report Inappropriate Content
Based on what I am understand, it almost seems like you need an IntervalMatch. I will try to get a sample across....
- « Previous Replies
- Next Replies »