Unlock a world of possibilities! Login now and discover the exclusive benefits awaiting you.
- Qlik Community
- :
- All Forums
- :
- QlikView App Dev
- :
- Re: Insert extra symbols into a grid chart
- Subscribe to RSS Feed
- Mark Topic as New
- Mark Topic as Read
- Float this Topic for Current User
- Bookmark
- Subscribe
- Mute
- Printer Friendly Page
- Mark as New
- Bookmark
- Subscribe
- Mute
- Subscribe to RSS Feed
- Permalink
- Report Inappropriate Content
Insert extra symbols into a grid chart
Hi experts,
I've the application in annex that shows the route of some individuals.My question is: Is possible to insert extra imagens/symbols into a Grid Chart? Something like this:
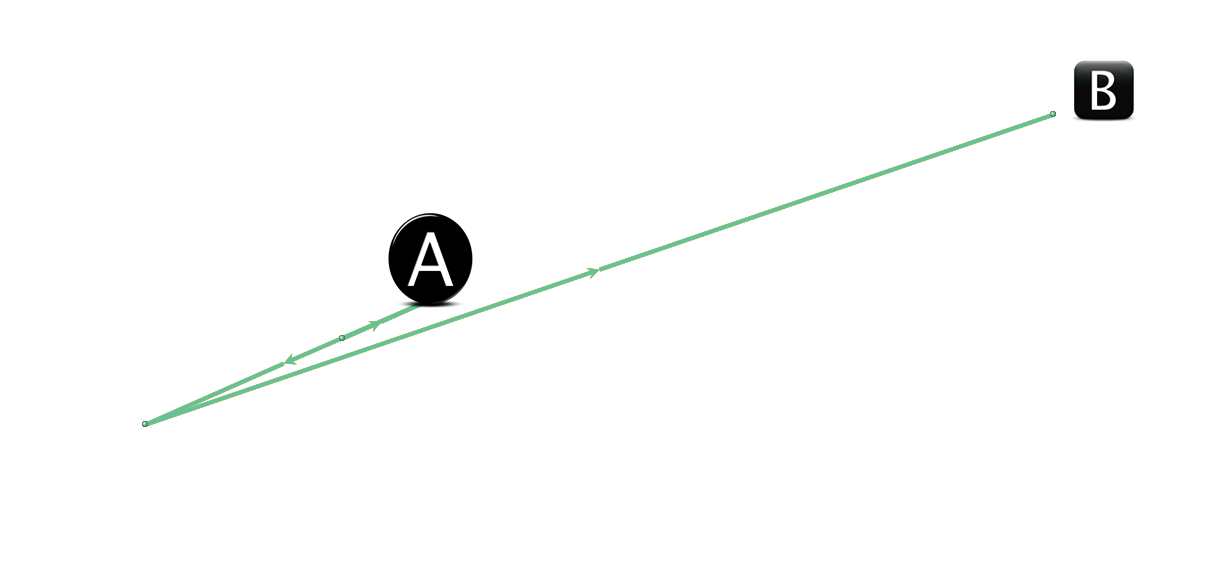
Where A is the beginning of the route and B the end.
In this case I'm using two imagens in front of the chart, but this isn't a solution because I need to ensure that these two points come with the beginning and end of the road automatically.
Anyone knows if I can do this?
Thanks! 
- Mark as New
- Bookmark
- Subscribe
- Mute
- Subscribe to RSS Feed
- Permalink
- Report Inappropriate Content
I think you posted the wrong qlikview document. I don't see how one can extract a route from the data in that document.
talk is cheap, supply exceeds demand
- Mark as New
- Bookmark
- Subscribe
- Mute
- Subscribe to RSS Feed
- Permalink
- Report Inappropriate Content
Hi Gysbert,
Thanks for your response 
The qvw is just a example of the grid chart. In my real qlikview document I've an image (like a map) inside the chart and then I can see the route based on the direction of the lines and the points. What I'm trying to do is put external images inside the symbols to mark the begining and the end.
Thanks!
- Mark as New
- Bookmark
- Subscribe
- Mute
- Subscribe to RSS Feed
- Permalink
- Report Inappropriate Content
You qvw does not contain a grid chart. It only contains a script that can load two small tables. I have no idea how that document should make clear what you want.
talk is cheap, supply exceeds demand
- Mark as New
- Bookmark
- Subscribe
- Mute
- Subscribe to RSS Feed
- Permalink
- Report Inappropriate Content
Can you see the chart in this?
- Mark as New
- Bookmark
- Subscribe
- Mute
- Subscribe to RSS Feed
- Permalink
- Report Inappropriate Content
I see it, but I don't understand it at all. You add a totally arbitrary dimension to it so it shows a line. What meaning does that have?
talk is cheap, supply exceeds demand
- Mark as New
- Bookmark
- Subscribe
- Mute
- Subscribe to RSS Feed
- Permalink
- Report Inappropriate Content
No, you can't add custom images to grid chart. Maybe there's an extension that does.
- Mark as New
- Bookmark
- Subscribe
- Mute
- Subscribe to RSS Feed
- Permalink
- Report Inappropriate Content
Each point represents a house, and the line the path that pearson do ordering by column 'Order_entry'
- Mark as New
- Bookmark
- Subscribe
- Mute
- Subscribe to RSS Feed
- Permalink
- Report Inappropriate Content
Thanks Lucian
And do you know if it is possible to define a different colour to symbols and another for the lines?
Thanks!