Unlock a world of possibilities! Login now and discover the exclusive benefits awaiting you.
- Qlik Community
- :
- All Forums
- :
- QlikView App Dev
- :
- Is it possible to sort draw order of line charts?
- Subscribe to RSS Feed
- Mark Topic as New
- Mark Topic as Read
- Float this Topic for Current User
- Bookmark
- Subscribe
- Mute
- Printer Friendly Page
- Mark as New
- Bookmark
- Subscribe
- Mute
- Subscribe to RSS Feed
- Permalink
- Report Inappropriate Content
Is it possible to sort draw order of line charts?
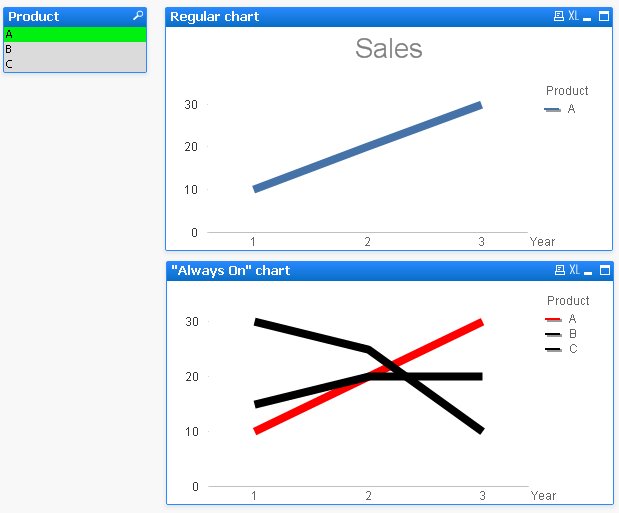
In the attached QVW, I have on top a regular line chart that responds to the list box by drawing only the selected products, and on the bottom a multi-line chart that always draws all the products but shows the selected products in red and unselected in black.
If you look carefully, product A is always drawn first, then B then C. What I want is for the selected products to always be drawn last, so they will appear to be on top.
I thought I could accomplish this by using the "sort" tab in various means, but I can't seem to. Does anyone have a solution which only uses a single chart? I don't want to have to overlay multiple charts.
Thanks!
Accepted Solutions
- Mark as New
- Bookmark
- Subscribe
- Mute
- Subscribe to RSS Feed
- Permalink
- Report Inappropriate Content
You can use the Dual() function to assign the numeric value to the Product Field. Then you need to use Expression sorting for Product Field.
I'm attaching the example for your reference.
Cheers,
DV
- Mark as New
- Bookmark
- Subscribe
- Mute
- Subscribe to RSS Feed
- Permalink
- Report Inappropriate Content
Deepak,
That's indeed a good way to get the result. Thank you very much. I also tried an aggr() function in the sort field and that worked as well, without having to assign a number in the script load stage. I realize it may adversely affect performance. 
Now, to add a twist to the problem, is there a way to make the chart lines colored green, white, grey, based on the associative status like the way list boxes are colored?
That would be sweet!
Chester
- Mark as New
- Bookmark
- Subscribe
- Mute
- Subscribe to RSS Feed
- Permalink
- Report Inappropriate Content
Hi Chester,
You are welcome. Interesting to know that you have used Aggr() function and I think it will be okay to use the Aggr() function because it assumes implicit Distinct Qualifier unlike other aggregation functions. Stefan (swuehl) gave nice insight on Aggr() function, please check this post.
Second requirement is very interesting and I'm not sure if we can use current Line Chart to test this requirement. I have made some progress and please let me know if this is what you are looking for or you might need more functionality.
Explanation :
Step 1 : Created vMyCondition Variable with following expression :
='(GetSelectedCount(' & Concat(Distinct $Field, ') = 0 AND GetSelectedCount(' ) & ') = 0) '
This expression creates the dynamic expression on all the fields.
Step 2 : Using the dollar sign expansion feature I'm evaluating the conditions to check if there are any selections.
IF(
$(=vMyCondition) = -1, White(),
IF(sum({$} Sales) > 0, Green(), QlikTechGray())
)
Note : I have changed the chart background to light purple color so that we can see the White() or Possible selections on the chart.
I hope this makes sense and I'm sure you might have more ideas to improve this one.
Thanks again for interesting question.
Cheers,
DV
- Mark as New
- Bookmark
- Subscribe
- Mute
- Subscribe to RSS Feed
- Permalink
- Report Inappropriate Content
Deepak,
Your attempt gets us very close to the outcome. It's a big improvement.
The part that needs to be fixed is this:
Clear selections and select 20 in the Sales list box. The line chart should be colored according to the product list box, so that products A and C are white and B is grey.
Do you think that is possible? Of course, the meaning of a color-coded multidimensional line chart becomes a bit fuzzy.
Chester
- Mark as New
- Bookmark
- Subscribe
- Mute
- Subscribe to RSS Feed
- Permalink
- Report Inappropriate Content
Hi,
This seemed like an interesting problem. I've attached an updated version of the qvw with a new chart. I think it has the basics covered but assuming product names like A, AA, AAA and so on exist, it might require some fine tuning I think there might also be better ways to figure out if a value is selected or possible, but string functions will work with a small dataset.
Hope this helps!
-Teemu
- Mark as New
- Bookmark
- Subscribe
- Mute
- Subscribe to RSS Feed
- Permalink
- Report Inappropriate Content
Teemu - Good job and I think you got it working by using FindOneOf() function.
Chester - This is interesting now and it is challenging at the same time. I have got it working using Aggr() and Set Analysis. I have added one more field to see how my expression behaves. I have done this assuming that you wanted to implement this in real world application with complex data model. I have also improvised my previous expression and here is what you need :
__________________________________________________________
__________________________________________________________
Solution 1:
Expression :
IF(
$(=vMyCondition) = -1, White(),
IF(SUM({<Product = {$(=CONCAT(Distinct Product,',')) } >} TOTAL <Product> Sales) > 0 AND GetSelectedCount(Product) = 0, White(),
IF(SUM({<Product = {$(=CONCAT(Distinct Product,','))} >} TOTAL <Product> Sales) > 0 AND GetSelectedCount(Product) > 0, Green()
, QlikTechGray())
))
Explanation :
- First IF conditional statement is evaluating if there is any selection on any fields in my data model and if there is no selection at all then use White() colour
- Second statement checks two conditons : (1) It checks if selection count on Product field is zero, which is GetSelectedCount(Product) = 0 and (2) Using Set Analyis I'm restricting only possible values of Product field. And if both the conditions are true then use White() colour
- Third statement works as second statment but it checks if there is any selection count on Product field which is greater than zero (GetSelectedCount(Product) > 0,). If this condition is true then it means there is selection on Product field, hence I'm using Green() colour
- Finally, if all the above condtions are false then use QlikTechGray() colour
__________________________________________________________
__________________________________________________________
Solution 2:
Taking this a step further where I'm also controlling Year Dimension in my Line Chart. For example, if I select value = 20 on Sales field then I wanted to see Product {A,B} in White() colour and at the sametime we wanted to see Year = {1} in QlikTechGray() colour because it is excluded value within Year field. But we wanted to see Year={2,3} in White() colour because they are possible values for this field. I hope this makes sense.
Expression :
IF(
$(=vMyCondition) = -1, White(),
IF(Aggr(SUM({<Product = {$(=CONCAT(Distinct Product,','))}>} Sales), $(=vAllDimensions)) > 0 AND GetSelectedCount(Product) = 0, White(),
IF(Aggr(SUM({<Product = {$(=CONCAT(Distinct Product,','))}>} Sales), $(=vAllDimensions)) > 0 AND GetSelectedCount(Product) > 0, Green(),
IF(Aggr(SUM({<Product = {$(=CONCAT(Distinct Product,','))}>} Sales), $(=vAllDimensions)) > 0 AND GetSelectedCount(Product) = 0 AND GetSelectedCount(Year) > 0, White()
, QlikTechGray())
)))
This expression works very similar to first solution but it's still sensitive on Year field.
__________________________________________________________
__________________________________________________________
I hope all this makes sense. Please let me know if you have any questions.
Note : We can take this one more step further by writing generic expressions which works on any Dimension or any QlikView document. But I'm not going to do it unless I'm re-using this functionality/feature in many applications.
Thanks again for asking this question and appreciate for providing detailed explanation with example.
Cheers,
DV
- Mark as New
- Bookmark
- Subscribe
- Mute
- Subscribe to RSS Feed
- Permalink
- Report Inappropriate Content
Wow, you guys are amazing.
Teemu - I like your solution because the expression that goes into the line color is so darn intuitive:
= If(FindOneOf(vSelectedProducts, Only({1}Product)) > 0, Green(),
If(FindOneOf(vPossibleProducts, Only({1}Product)) > 0, White(),
QlikTechGray()))
Deepak - your solution 1 does exactly what I wanted it to do, without having to change the load script. I wonder if there's a way to simplify your expression by using variables to improve the readability. If the expression could be genericized so that others can apply it easily to their charts, that would be awesome.
IF(
$(=vMyCondition) = -1, White(),
IF(SUM({<Product = {$(=CONCAT(Distinct Product,',')) } >} TOTAL <Product> Sales) > 0 AND GetSelectedCount(Product) = 0, White(),
IF(SUM({<Product = {$(=CONCAT(Distinct Product,','))} >} TOTAL <Product> Sales) > 0 AND GetSelectedCount(Product) > 0, Green()
, QlikTechGray())
))
Has anyone on the community ever wanted to express green-white-grey on a chart for a real-life purpose?
Chester