Unlock a world of possibilities! Login now and discover the exclusive benefits awaiting you.
- Qlik Community
- :
- All Forums
- :
- QlikView App Dev
- :
- Re: Issue with Line Chart
- Subscribe to RSS Feed
- Mark Topic as New
- Mark Topic as Read
- Float this Topic for Current User
- Bookmark
- Subscribe
- Mute
- Printer Friendly Page
- Mark as New
- Bookmark
- Subscribe
- Mute
- Subscribe to RSS Feed
- Permalink
- Report Inappropriate Content
Issue with Line Chart
Hi Experts,
I am trying to make a line chart with a data set which has 2 set of data.. Month and percentage. The 1st column has the month and the 2nd column has the percentage for some data. As shown below.
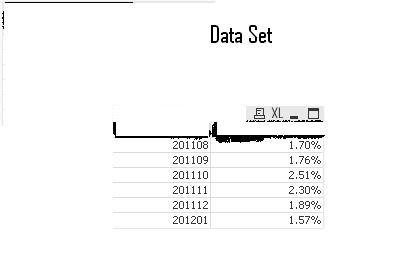
But when I try to make a line chart with this data, the percentage appearing on the chart changes (as shown below)
If you notice the original data set it shows data as 1.70%,1.76%,2.51%,2.30% etc where as the graph shows 14%,16%,18%,20% etc..
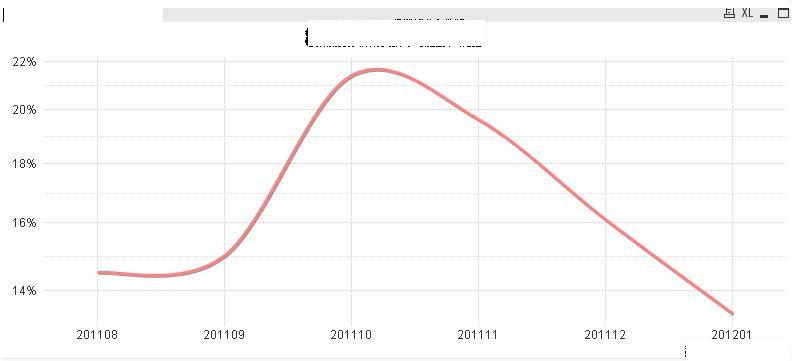
Can anyone help me how to fix this. I want to show the actual percentage in the line chart that appears in the data set.
Thanks
Paul..
Accepted Solutions
- Mark as New
- Bookmark
- Subscribe
- Mute
- Subscribe to RSS Feed
- Permalink
- Report Inappropriate Content
Hi
Hope because of the attached image will help you to find your problem in your line chart.
Your just un check the relative check box from chart-->expression and then check you will get the same error or
not..
Regards
Ashok
- Mark as New
- Bookmark
- Subscribe
- Mute
- Subscribe to RSS Feed
- Permalink
- Report Inappropriate Content
Thanks Ashok..
It worked !