Unlock a world of possibilities! Login now and discover the exclusive benefits awaiting you.
- Qlik Community
- :
- All Forums
- :
- QlikView App Dev
- :
- Issue with Normal Distribution(Gaussian Distributi...
- Subscribe to RSS Feed
- Mark Topic as New
- Mark Topic as Read
- Float this Topic for Current User
- Bookmark
- Subscribe
- Mute
- Printer Friendly Page
- Mark as New
- Bookmark
- Subscribe
- Mute
- Subscribe to RSS Feed
- Permalink
- Report Inappropriate Content
Issue with Normal Distribution(Gaussian Distribution)
Dear Community,
I had an issue with Normal Distribution Curve. My curve shows like below Image:
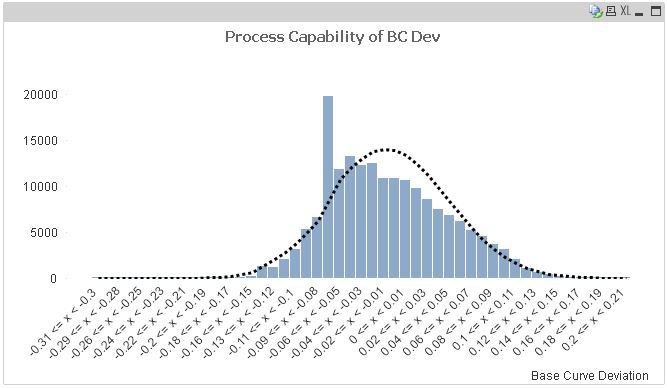
Here My Dimesnion is =if(BC_DEV<>' ', class(BC_DEV,0.01))
Expressions:
For Bars: =Count(DISTINCT LENS_MASTER_SEQUENCE)
For Bell Curve: =if(BC_DEV<>'',NORMDIST(Class(BC_DEV,'0.01'),avg({1}TOTAL BC_DEV),Stdev({1}TOTAL BC_DEV),0))*2000
In the above expression I am Multiplying the expression with 2000 to get the curve in bell shape, otherwise it is like a flat straighline on X-Axis. And also I do not want to make the expression static by multiplying with 2000 or any other number.
If I make any selections I am not getting the exact curve for those particular filters. Please find the image below:

I want the Normal Curve to be calculated for any selections.
Please help me in achieving this. Thanks a ton in advance.
Regards
Manideep
- « Previous Replies
-
- 1
- 2
- Next Replies »
- Mark as New
- Bookmark
- Subscribe
- Mute
- Subscribe to RSS Feed
- Permalink
- Report Inappropriate Content
Can anyone please help me?
- Mark as New
- Bookmark
- Subscribe
- Mute
- Subscribe to RSS Feed
- Permalink
- Report Inappropriate Content
Hi
Your chart is showing the fragment of the bell curve within your selection. You need your bell curve expression to take your selection into account. Try first with:
=if(BC_DEV<>'',NORMDIST(Class(BC_DEV,'0.01'),avg(TOTAL BC_DEV),Stdev(TOTAL BC_DEV),0))*2000
(remove the {1}'s)
HTH
Jonathan
- Mark as New
- Bookmark
- Subscribe
- Mute
- Subscribe to RSS Feed
- Permalink
- Report Inappropriate Content
Yeah Jonathan Dienst. I am getting the curve. But I did not need the normal curve to be multiplied with 2000. Can you please tell me the best method. If I am not doing with 2000 or some other number I am getting a straight line along X-axis as I have my frequency in thousands.
- Mark as New
- Bookmark
- Subscribe
- Mute
- Subscribe to RSS Feed
- Permalink
- Report Inappropriate Content
If you need to adjust the 2000 to reflect the selections you have made, so this will need to be calculated by an expression.
I can help you with details if you explain how you arrived at the value of 2000 for the full chart and post a sample of your qvw.
HTH
Jonathan
- Mark as New
- Bookmark
- Subscribe
- Mute
- Subscribe to RSS Feed
- Permalink
- Report Inappropriate Content
Thanks Jonathan Dienst. Pls find my sample app attached. When I am using an expression instead of 2000 I am not getting a smooth bell curve as it was as earlier in this app. and If I made any selections I am not getting the ryt curve. and also I need 0.02 as my Class interval not 0.01. please find the attachment.
- Mark as New
- Bookmark
- Subscribe
- Mute
- Subscribe to RSS Feed
- Permalink
- Report Inappropriate Content
I think that this is what you want. I have taken away the scaling and moved the curve to the right axis, and hidden the axis. Note that the curve will be distorted when only a few data points are selected as it is only calculated at these locations.
Jonathan
- Mark as New
- Bookmark
- Subscribe
- Mute
- Subscribe to RSS Feed
- Permalink
- Report Inappropriate Content
I am unable to open your file. giving an error message like unable to load file.
- Mark as New
- Bookmark
- Subscribe
- Mute
- Subscribe to RSS Feed
- Permalink
- Report Inappropriate Content
Looks like it did not upload correctly. Should be 2MB. Attached again...
- Mark as New
- Bookmark
- Subscribe
- Mute
- Subscribe to RSS Feed
- Permalink
- Report Inappropriate Content
Thanks Jonathan Dienst.
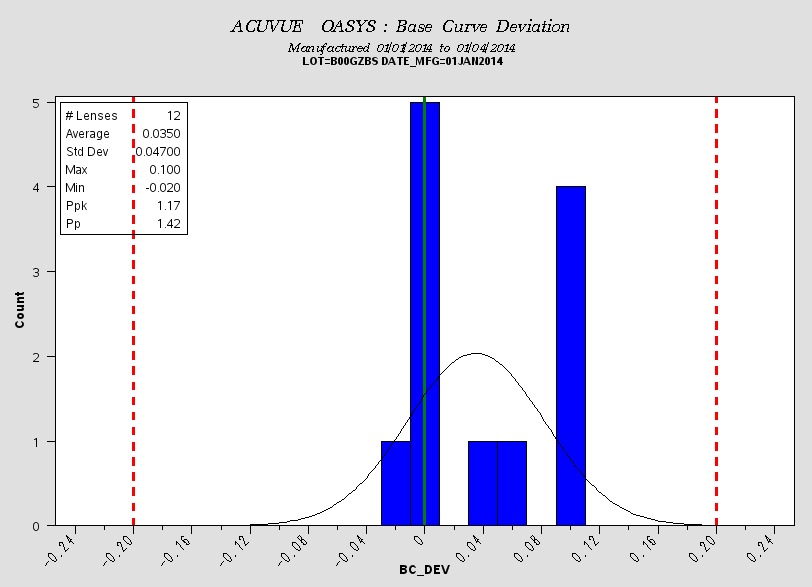
Yeah it was similar to my requirement. But In the same App I need the Vertical Reference Lines, LSL, USL and also at 0. And also for some cases I want my curve to be starting at 0. But if you look the app with some filters like LOT = B00GZBS, B00GZBV and B00GZBZ it is not starting at 0 level. Can you please look at this. I am attaching the images from the Sas report based on the above mentioned lots.. I want the same or something similar in Qlikview. Please help me in achieving this.
- « Previous Replies
-
- 1
- 2
- Next Replies »