Unlock a world of possibilities! Login now and discover the exclusive benefits awaiting you.
- Qlik Community
- :
- All Forums
- :
- QlikView App Dev
- :
- Layout Design
- Subscribe to RSS Feed
- Mark Topic as New
- Mark Topic as Read
- Float this Topic for Current User
- Bookmark
- Subscribe
- Mute
- Printer Friendly Page
- Mark as New
- Bookmark
- Subscribe
- Mute
- Subscribe to RSS Feed
- Permalink
- Report Inappropriate Content
Layout Design
Hi All,
Can anyone help me in attached layout design.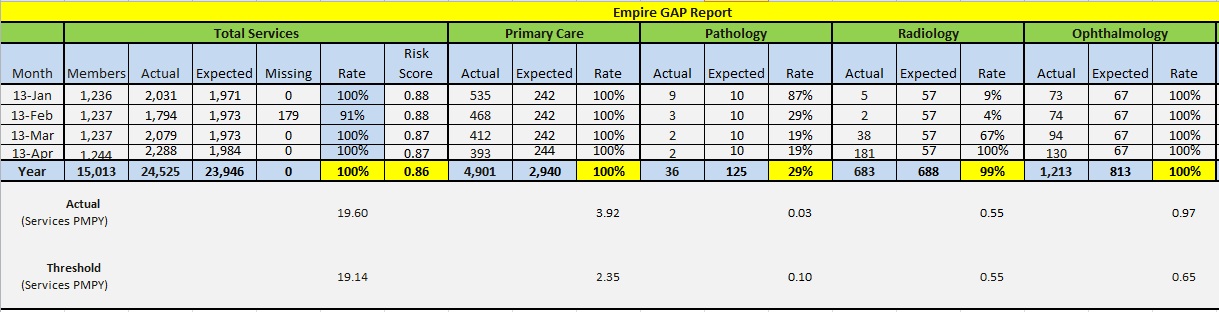
how to design the table as same as in image?
- Mark as New
- Bookmark
- Subscribe
- Mute
- Subscribe to RSS Feed
- Permalink
- Report Inappropriate Content
It is not possible to get entire report using one chart as you have different metrics.
you need to use two charts side by side.
one pivot table for Total Services and second report for the remaining.
Bottom part can be done using text objects.
- Mark as New
- Bookmark
- Subscribe
- Mute
- Subscribe to RSS Feed
- Permalink
- Report Inappropriate Content
you can try something like the example attached
regards
- Mark as New
- Bookmark
- Subscribe
- Mute
- Subscribe to RSS Feed
- Permalink
- Report Inappropriate Content
Hi,
Just by seeing the image, it may be possible to get that design, but you'll need to use some tricks (like pick(match()) and use a pivot table. However is hard to tell you the steps to follow without seeing a sample of your data. Could you upload a sample of your qvw please?
regards
- Mark as New
- Bookmark
- Subscribe
- Mute
- Subscribe to RSS Feed
- Permalink
- Report Inappropriate Content
also to color cell you can do this
- Mark as New
- Bookmark
- Subscribe
- Mute
- Subscribe to RSS Feed
- Permalink
- Report Inappropriate Content
Thanks all.
Jaime Aguilar,
Just now i got requirement yet to build the QWV. If you have time can please help in the steps to design the same.
- Mark as New
- Bookmark
- Subscribe
- Mute
- Subscribe to RSS Feed
- Permalink
- Report Inappropriate Content
Can you attach a sample app. I believe pivot table will be a best fit for it.
- Mark as New
- Bookmark
- Subscribe
- Mute
- Subscribe to RSS Feed
- Permalink
- Report Inappropriate Content
Hi,
maybe something like the attached example. However depending on your datasources, I think it will be necessary to make some modifications,
regards
- Mark as New
- Bookmark
- Subscribe
- Mute
- Subscribe to RSS Feed
- Permalink
- Report Inappropriate Content
Hi Jaime,
Thanks for give a idea.
But it didn't help me, In total service ve have 5 columns and other ve have 3 columns and bottom its a separete expression.
can any one help me in this design.