Unlock a world of possibilities! Login now and discover the exclusive benefits awaiting you.
- Qlik Community
- :
- All Forums
- :
- QlikView App Dev
- :
- Line chart problem: Using Continous option in Axes...
- Subscribe to RSS Feed
- Mark Topic as New
- Mark Topic as Read
- Float this Topic for Current User
- Bookmark
- Subscribe
- Mute
- Printer Friendly Page
- Mark as New
- Bookmark
- Subscribe
- Mute
- Subscribe to RSS Feed
- Permalink
- Report Inappropriate Content
Line chart problem: Using Continous option in Axes tab turns my MonthYear values into numeric values?
Hello,
I am having a problem with my line chart:
Dimension: MonthYear (values are Jan 2017, Feb 2017 etc)
Measure: Count(Orders)
The line chart works perfectly when it is like this.
However
When I go to Axes tab and tick Continous it turns the labels into numeric values.
How can I ensure while Continious is ticked it shows the actual MonthYear labels as original (e.g. Jan 2017, Feb 2017 etc)?
I tried Date(Date, 'MMM') & ' ' & Year(Date) but it does not work as Continous option means it expects numeric values.
We are using v12.0 of QlikView.
Accepted Solutions
- Mark as New
- Bookmark
- Subscribe
- Mute
- Subscribe to RSS Feed
- Permalink
- Report Inappropriate Content
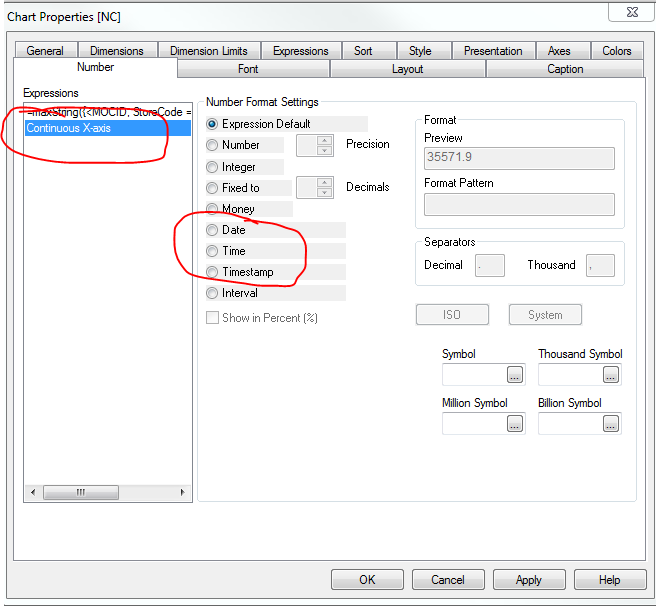
After setting the continuous axis, go to the number's tab and set your continuous X-axis's format from there
- Mark as New
- Bookmark
- Subscribe
- Mute
- Subscribe to RSS Feed
- Permalink
- Report Inappropriate Content
After setting the continuous axis, go to the number's tab and set your continuous X-axis's format from there
- Mark as New
- Bookmark
- Subscribe
- Mute
- Subscribe to RSS Feed
- Permalink
- Report Inappropriate Content
Sunny, it's great you are here to help. Problem solved. Thank you!