Unlock a world of possibilities! Login now and discover the exclusive benefits awaiting you.
- Qlik Community
- :
- All Forums
- :
- QlikView App Dev
- :
- Re: Mixing symbols and bars on combo chart (for ga...
- Subscribe to RSS Feed
- Mark Topic as New
- Mark Topic as Read
- Float this Topic for Current User
- Bookmark
- Subscribe
- Mute
- Printer Friendly Page
- Mark as New
- Bookmark
- Subscribe
- Mute
- Subscribe to RSS Feed
- Permalink
- Report Inappropriate Content
Mixing symbols and bars on combo chart (for gantt)
Hi everyone,
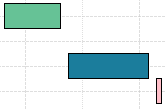
I am working with date data that contains tasks and milestones that I want to put into a Combo chart. In the past, I've had separate date fields containing my milestones (which I can just drop into the chart as expressions and have show up as milestones). With bar charts, however, my milestones go missing because their duration is 0 (see below screenshot--2nd line should contain a milestone between the blue and green bars).
Is the best way to get my milestones to show up:
1) By adding them as expressions shown as Symbols (I've tried to make this work--no dice yet)
2) By modifying my expression for 0 duration entries to have them show up--so something like:
(max(TaskFinishDate))-(min(TaskStartDate)-1)
3) Another way?
Please help. Thanks!
- Mark as New
- Bookmark
- Subscribe
- Mute
- Subscribe to RSS Feed
- Permalink
- Report Inappropriate Content
For my gantt I use an IF
IF it is a milestone, then duration = 1
IF it is a milestone, then duration = max(TaskFinishDate))-(min(TaskStartDate))
I am interested in how you do your gantt : could you share it or would it pose a problem ?
- Mark as New
- Bookmark
- Subscribe
- Mute
- Subscribe to RSS Feed
- Permalink
- Report Inappropriate Content
the second one is of course IF it is NOT a milestone
- Mark as New
- Bookmark
- Subscribe
- Mute
- Subscribe to RSS Feed
- Permalink
- Report Inappropriate Content
I should have also mentioned that I use conditionals to evaluate tasks with duration <>0 and tasks with duration =0. While I can't show you the gantt with the exact material I am using, I can give you the general flavor of how it's put together...
Expression for gantt bars:
if(TaskDays<>0, max(TaskFinishDate)-min(TaskStartDate), max(TaskFinishDate)-min(TaskStartDate-1))
I have tried using RangeMax and RangeMin functions before to combine tasks onto the same row (to show discrete periods of non-activity), but I have not gotten to the point where it works properly for all my selections.
Bar Offset:
min(TaskStartDate)
Dimensions
I use a drill-down dimension with 3 different fields--so as you drill in, it shows the total summary length of the activity, then the sub-components, and finally the discrete tasks.
- Mark as New
- Bookmark
- Subscribe
- Mute
- Subscribe to RSS Feed
- Permalink
- Report Inappropriate Content
OK no problem I understand
your expression if(TaskDays<>0, max(TaskFinishDate)-min(TaskStartDate), max(TaskFinishDate)-min(TaskStartDate-1))
looks like what i wrote in my post (because I suppose that if TaskDays=0 max(TaskFinishDate)-min(TaskStartDate-1)) Is The same as =1
So I don't understand : do you still have a problem or is it OK now ?
- Mark as New
- Bookmark
- Subscribe
- Mute
- Subscribe to RSS Feed
- Permalink
- Report Inappropriate Content
I guess I fixed my initial problem (did it in between answers) but I'm still curious if you can pull out the milestones in a separate expression to display on the gantt.
- Mark as New
- Bookmark
- Subscribe
- Mute
- Subscribe to RSS Feed
- Permalink
- Report Inappropriate Content
I think I tried putting symbols but didn't manage to do it
- Mark as New
- Bookmark
- Subscribe
- Mute
- Subscribe to RSS Feed
- Permalink
- Report Inappropriate Content
Hi John,
If you still interested I managed to mix symbol wwith bar chart in my gantt.
For my milestones, I use the expression : max(TaskFinishDate) AND NO OFFSET.
- Mark as New
- Bookmark
- Subscribe
- Mute
- Subscribe to RSS Feed
- Permalink
- Report Inappropriate Content
Thanks yadurand. We've done something similar before (same expression, except aggregated onto the same row with the duration representing an entire project's duration), but I think the expressions are going to be something a little more complicated.
Since we have to differentiate between tasks and milestones, there have to at least be 2 separate expressions (one to handle bars-->1 duration and one to handle milestones--duration =0) Since the dimenions are tasks, the expressions need to accurately display the milestones where appropriate.
I can update this thread as I make findings (-if- I make findings...)