Unlock a world of possibilities! Login now and discover the exclusive benefits awaiting you.
- Qlik Community
- :
- All Forums
- :
- QlikView App Dev
- :
- Multiple needles in gauge chart (tachometer)
- Subscribe to RSS Feed
- Mark Topic as New
- Mark Topic as Read
- Float this Topic for Current User
- Bookmark
- Subscribe
- Mute
- Printer Friendly Page
- Mark as New
- Bookmark
- Subscribe
- Mute
- Subscribe to RSS Feed
- Permalink
- Report Inappropriate Content
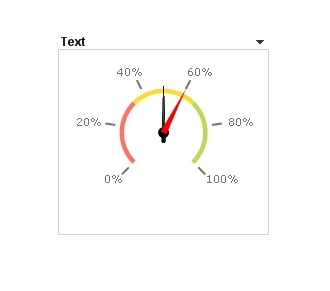
Multiple needles in gauge chart (tachometer)
Hi all,
I would like to create a gauge (tachometer) chart in which a needle is shown for each expression. Is this possible?
I know that I can group the different expressions and select each expression by clicking the circled arrow. But I would like to the all (in my case 3) needles at the same time with different colors and a legend.
I hope that you are able to help me, thanks a lot in advance.
Regards
Jens
- Mark as New
- Bookmark
- Subscribe
- Mute
- Subscribe to RSS Feed
- Permalink
- Report Inappropriate Content
Hi Jens, as far as I know this is not "normally" possible, you have to work around using expressions based on other expressions.
See my solution here http://community.qlik.com/message/39525#39525
I'll try and see if I can post an example...
Erica
- Mark as New
- Bookmark
- Subscribe
- Mute
- Subscribe to RSS Feed
- Permalink
- Report Inappropriate Content
Hi Jens, please see attached workaround
In a nutshell, this guage chart "fakes" the needles by using black dummy segments to mimick the needles. There are 4 variables, 3 that define the values of the "needles" and one to show where the limit needs to go (vBoundary)
In the chart presentation tab, I have removed the indicator and unchecked the box marked "autowidth segments", enabling me to edit where the segments start and end.
The 9 segment boundaries are defined as this:
Segment 0 - Lower bound = 0 , colour green
Segment 1 - lower bound - minimum of the vBoundary, and the 3 expression variables. Colour is black (needle colour)
Segment 1a - lower bound - same as segment 1 if this is equal to the vBoundary. Otherwise it is set at vBoundary + 0.05 (width of needle). The colour of the segment is dependant on where the boundary is
.
.
.
.
And so each of the pairs of segments follows a different pattern till Segment 4 and Segment 4a. Took me a while to get me head around it.
Hope this works for you!
Regards,
Erica
- Mark as New
- Bookmark
- Subscribe
- Mute
- Subscribe to RSS Feed
- Permalink
- Report Inappropriate Content
Pls refer this..
- Mark as New
- Bookmark
- Subscribe
- Mute
- Subscribe to RSS Feed
- Permalink
- Report Inappropriate Content
what about overlapping charts?