Unlock a world of possibilities! Login now and discover the exclusive benefits awaiting you.
- Qlik Community
- :
- All Forums
- :
- QlikView App Dev
- :
- Need help with coloring expression for line graph
- Subscribe to RSS Feed
- Mark Topic as New
- Mark Topic as Read
- Float this Topic for Current User
- Bookmark
- Subscribe
- Mute
- Printer Friendly Page
- Mark as New
- Bookmark
- Subscribe
- Mute
- Subscribe to RSS Feed
- Permalink
- Report Inappropriate Content
Need help with coloring expression for line graph
I have a line graph with two dimensions X Axis - (Date), Line - (Business) and an expression the Y-Axis is (Count of Widgets).
I use set analysis in the expression so that no matter what Business or Date is selected the chart shows all values.
Expression (Named: Number of Widgets):
=sum({<Business=,Date=>}Count_of_Widgets)
Date has three values
1/1/2016, 2/1/2016,3/1/2016
Business has three values for each Date,
R, G, B
| Date | Business | Count of Widgets |
|---|---|---|
| 1/1/2016 | R | 1 |
| 1/1/2016 | B | 2 |
| 1/1/2016 | G | 3 |
| 2/1/2016 | R | 4 |
| 2/1/2016 | B | 5 |
| 2/1/2016 | G | 6 |
| 3/1/2016 | R | 7 |
| 3/1/2016 | B | 8 |
| 3/1/2016 | B | 9 |
When coloring the Expression, I have a different color for every business (R= Red, B=Blue,, G=Green) using the RGB logic The expression I use is:
IF(Business='R', RGB(255,0,0)
IF(Business='G',RGB(0,255,0)
IF(Business='B',RGB(0,0,255)
RGB(230,230,230)))
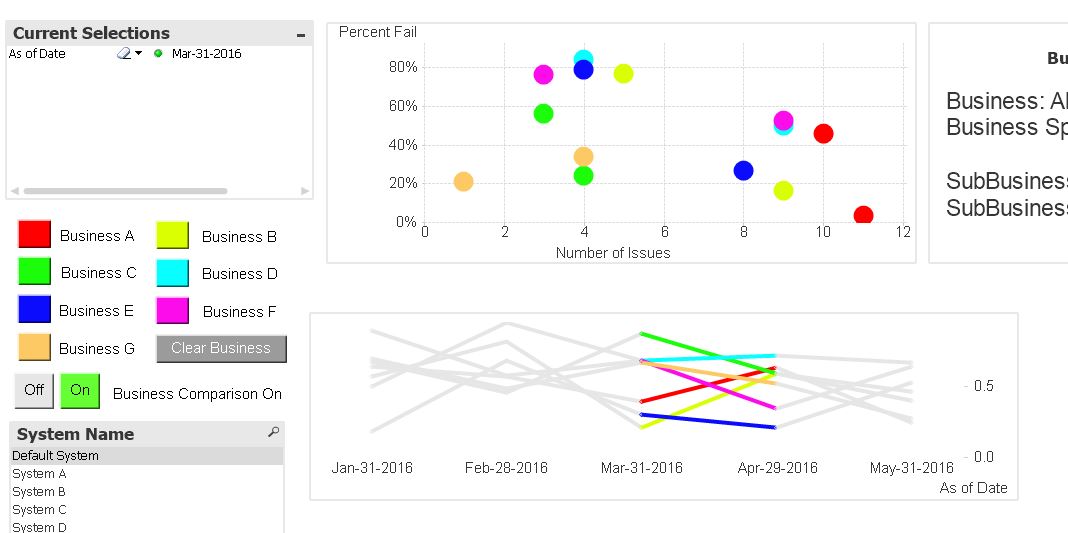
I want to be able to keep the coloring even if there is a selection on the Date field. But as of right now with the selection of a date, the other dates are shown as grey. Please note the image below does not match exactly the example above, it is a more complex version but the concept holds true..
Any help would be greatly appreciated. And as an FYI, I only have a personal edition so I cannot open other people's QVWs.
Accepted Solutions
- Mark as New
- Bookmark
- Subscribe
- Mute
- Subscribe to RSS Feed
- Permalink
- Report Inappropriate Content
Try this:
IF(Only({<Business=,Date=>}Business)='R', RGB(255,0,0)
IF(Only({<Business=,Date=>}Business)='G',RGB(0,255,0)
IF(Only({<Business=,Date=>}Business)='B',RGB(0,0,255)
RGB(230,230,230)))
- Mark as New
- Bookmark
- Subscribe
- Mute
- Subscribe to RSS Feed
- Permalink
- Report Inappropriate Content
That was it, thanks!!!