Unlock a world of possibilities! Login now and discover the exclusive benefits awaiting you.
- Qlik Community
- :
- All Forums
- :
- QlikView App Dev
- :
- Re: Not sufficient colours for line graphs availab...
- Subscribe to RSS Feed
- Mark Topic as New
- Mark Topic as Read
- Float this Topic for Current User
- Bookmark
- Subscribe
- Mute
- Printer Friendly Page
- Mark as New
- Bookmark
- Subscribe
- Mute
- Subscribe to RSS Feed
- Permalink
- Report Inappropriate Content
Not sufficient colours for line graphs available in QV?
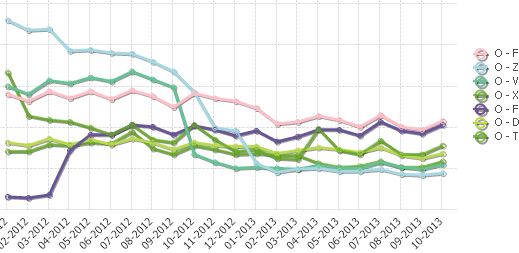
I have sales values for 650 different products loaded in QV. My problem: Sometimes, when I select couple of products to compare sales over time in a chart with line graphs QV doesn't seem to have sufficient colours to draw from, i.e. different graphs (= expression sum(sales)) are shown in the same colour (see below e.g. products = O - X and O - T seem to have the same colour). This doesn't always happen, but sometimes it does and it's very annoying. How can I make sure that when I select couple of products they all get assigned different colours? Thanks for any idea!
Accepted Solutions
- Mark as New
- Bookmark
- Subscribe
- Mute
- Subscribe to RSS Feed
- Permalink
- Report Inappropriate Content
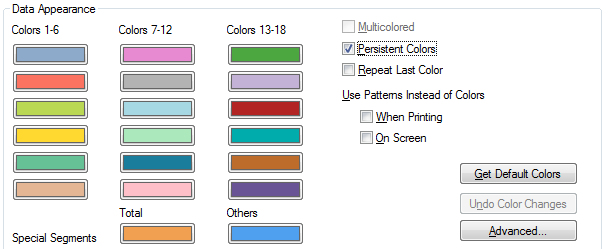
not the first 18 visible but the first 18 in general. If no filtering is applied, you have 650 lines. Colors are repeated every 18 lines, shown or not. You need to uncheck Persistent colors.
- Mark as New
- Bookmark
- Subscribe
- Mute
- Subscribe to RSS Feed
- Permalink
- Report Inappropriate Content
have you Persistent Colors checked? try this option.
- Mark as New
- Bookmark
- Subscribe
- Mute
- Subscribe to RSS Feed
- Permalink
- Report Inappropriate Content
I thought it should display the first 18 data points as 18 different colors.
Can you please create a new line chart and see if this happening?
- Mark as New
- Bookmark
- Subscribe
- Mute
- Subscribe to RSS Feed
- Permalink
- Report Inappropriate Content
not the first 18 visible but the first 18 in general. If no filtering is applied, you have 650 lines. Colors are repeated every 18 lines, shown or not. You need to uncheck Persistent colors.
- Mark as New
- Bookmark
- Subscribe
- Mute
- Subscribe to RSS Feed
- Permalink
- Report Inappropriate Content
from online help
colors are just repeated in succession from 1 to 18
if you want to have different color you have to use the background color in expression
- you can look at this post http://community.qlik.com/blogs/qlikviewdesignblog/2012/12/04/colors-in-charts
- or you can use some math to generate different rgb for every dimension value
- Mark as New
- Bookmark
- Subscribe
- Mute
- Subscribe to RSS Feed
- Permalink
- Report Inappropriate Content
if you need multiple colors then you need to change those color accordingly in colors tab in chart properties
- Mark as New
- Bookmark
- Subscribe
- Mute
- Subscribe to RSS Feed
- Permalink
- Report Inappropriate Content
If you want 650 different colors, I recomend you creating a table into your datamodel to acomodate all colors.
LOAD * INLINE [
Product, R, G, B
A, 253, 152, 150
B, 230, 160, 80
C, 234, 160, 90
D, 200, 160, 120
];
and use this as background color of your expression RGB(R,G,B)
QlikView supports 18 colors,
Remember that human eyes does not recognize too much variety of colors (8 or 9 usually)
- Mark as New
- Bookmark
- Subscribe
- Mute
- Subscribe to RSS Feed
- Permalink
- Report Inappropriate Content
Clever Anjos wrote:
...
Remember that human eyes does not recognize too much variety of colors (8 or 9 usually)
That's the key point.
So, if you have different color for each product, and the number of products is large, the colors are not helpful. But if the purpose is to have all colors different when you select a limited number of products, unchecking "Persistent colors", as Ioannis Giakoumakis advises, solves the problem
- Mark as New
- Bookmark
- Subscribe
- Mute
- Subscribe to RSS Feed
- Permalink
- Report Inappropriate Content
Thanks for the contribution. But the post you refer to explains how to hard code colours. Hard coding is not an option for me since every month the set of 600-700 products gets updated, and manually adapting a colour table is not a good solution.
- Mark as New
- Bookmark
- Subscribe
- Mute
- Subscribe to RSS Feed
- Permalink
- Report Inappropriate Content
This worked well for my purposes. Many thanks!