Unlock a world of possibilities! Login now and discover the exclusive benefits awaiting you.
- Qlik Community
- :
- All Forums
- :
- QlikView App Dev
- :
- Pie Chart inside Table
- Subscribe to RSS Feed
- Mark Topic as New
- Mark Topic as Read
- Float this Topic for Current User
- Bookmark
- Subscribe
- Mute
- Printer Friendly Page
- Mark as New
- Bookmark
- Subscribe
- Mute
- Subscribe to RSS Feed
- Permalink
- Report Inappropriate Content
Pie Chart inside Table
Hi!
I've got a file with the following 4 columns
State
Population
Male Population
Female Population
and I would like to graphically display data in a table with 3 columns
State
Population
Pie Chart created from Male and Female population
Is it possible to do it?
- Mark as New
- Bookmark
- Subscribe
- Mute
- Subscribe to RSS Feed
- Permalink
- Report Inappropriate Content
Hi.
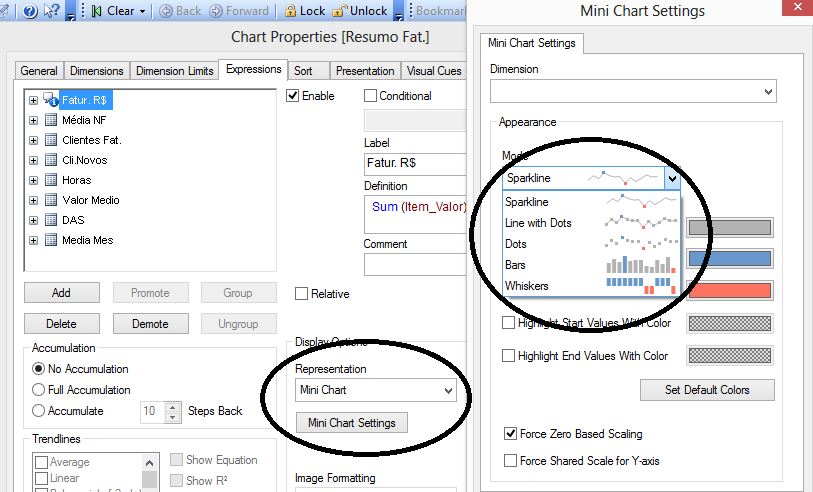
Table with graph you can fews. I don't know if is possible to put pie chart. Maybe someone else can help.
Alessandro Furtado
- Mark as New
- Bookmark
- Subscribe
- Mute
- Subscribe to RSS Feed
- Permalink
- Report Inappropriate Content
you can't really do a round pie... the closest you can do is a linear gauge, showing % Male population. The other part of the cell will represent the % Female. You may be able to paint the cell backgound in another color for better presentation...
cheers,
Oleg Troyansky