Unlock a world of possibilities! Login now and discover the exclusive benefits awaiting you.
- Qlik Community
- :
- All Forums
- :
- QlikView App Dev
- :
- Re: Pie Chart with wrong value - area
- Subscribe to RSS Feed
- Mark Topic as New
- Mark Topic as Read
- Float this Topic for Current User
- Bookmark
- Subscribe
- Mute
- Printer Friendly Page
- Mark as New
- Bookmark
- Subscribe
- Mute
- Subscribe to RSS Feed
- Permalink
- Report Inappropriate Content
Pie Chart with wrong value - area
Hi there,
My chart is strange while it's not showing the right value and area for some dimensions as shown on the picture attached.
Would be it a QlikView bug?
Accepted Solutions
- Mark as New
- Bookmark
- Subscribe
- Mute
- Subscribe to RSS Feed
- Permalink
- Report Inappropriate Content
I got the answer.
My chart has 2 types: bar or pie and it was setted to show scroll when the amount of itens be more than 15. When i removed that condition my chart got right.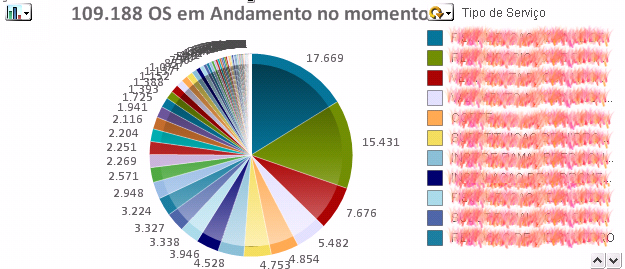
- Mark as New
- Bookmark
- Subscribe
- Mute
- Subscribe to RSS Feed
- Permalink
- Report Inappropriate Content
What version of QV are you running? I saw this problem in an earlier version of QV11.
- Mark as New
- Bookmark
- Subscribe
- Mute
- Subscribe to RSS Feed
- Permalink
- Report Inappropriate Content
Which version are you using?
Are you using dimension limits?
- Mark as New
- Bookmark
- Subscribe
- Mute
- Subscribe to RSS Feed
- Permalink
- Report Inappropriate Content
V. 11.20
- Mark as New
- Bookmark
- Subscribe
- Mute
- Subscribe to RSS Feed
- Permalink
- Report Inappropriate Content
V 11.20 and i'm not using Dimension Limits
thanks
- Mark as New
- Bookmark
- Subscribe
- Mute
- Subscribe to RSS Feed
- Permalink
- Report Inappropriate Content
What's your expression ?
- Mark as New
- Bookmark
- Subscribe
- Mute
- Subscribe to RSS Feed
- Permalink
- Report Inappropriate Content
Well,,, the numbers in the chart are correct, the only thing that is wrong is the area division.
But the expression is: Count({<[Código da Situação (OS)]={'*'}-{'2'}>} DISTINCT([Código OS] ))
- Mark as New
- Bookmark
- Subscribe
- Mute
- Subscribe to RSS Feed
- Permalink
- Report Inappropriate Content
I saw this problem on an earlier version of QV11 (version 11.0 SR1 or something). How I was able to fix it was by recreating the chart from scratch. Maybe give that a go.
- Mark as New
- Bookmark
- Subscribe
- Mute
- Subscribe to RSS Feed
- Permalink
- Report Inappropriate Content
I got the answer.
My chart has 2 types: bar or pie and it was setted to show scroll when the amount of itens be more than 15. When i removed that condition my chart got right.