Unlock a world of possibilities! Login now and discover the exclusive benefits awaiting you.
- Qlik Community
- :
- All Forums
- :
- QlikView App Dev
- :
- Poisson Distribution in Qlik Sense ?
- Subscribe to RSS Feed
- Mark Topic as New
- Mark Topic as Read
- Float this Topic for Current User
- Bookmark
- Subscribe
- Mute
- Printer Friendly Page
- Mark as New
- Bookmark
- Subscribe
- Mute
- Subscribe to RSS Feed
- Permalink
- Report Inappropriate Content
Poisson Distribution in Qlik Sense ?
Dear all,
has anyone implemented a Poisson distribution in QSense ?
Specifically, I would like to overlay a Poisson distribution to a (binned) histogram of e.g. Sales data (frequency: 0 items sold n times, 1 items sold m times, etc)
Many thanks in advance
Ulrich
- Mark as New
- Bookmark
- Subscribe
- Mute
- Subscribe to RSS Feed
- Permalink
- Report Inappropriate Content
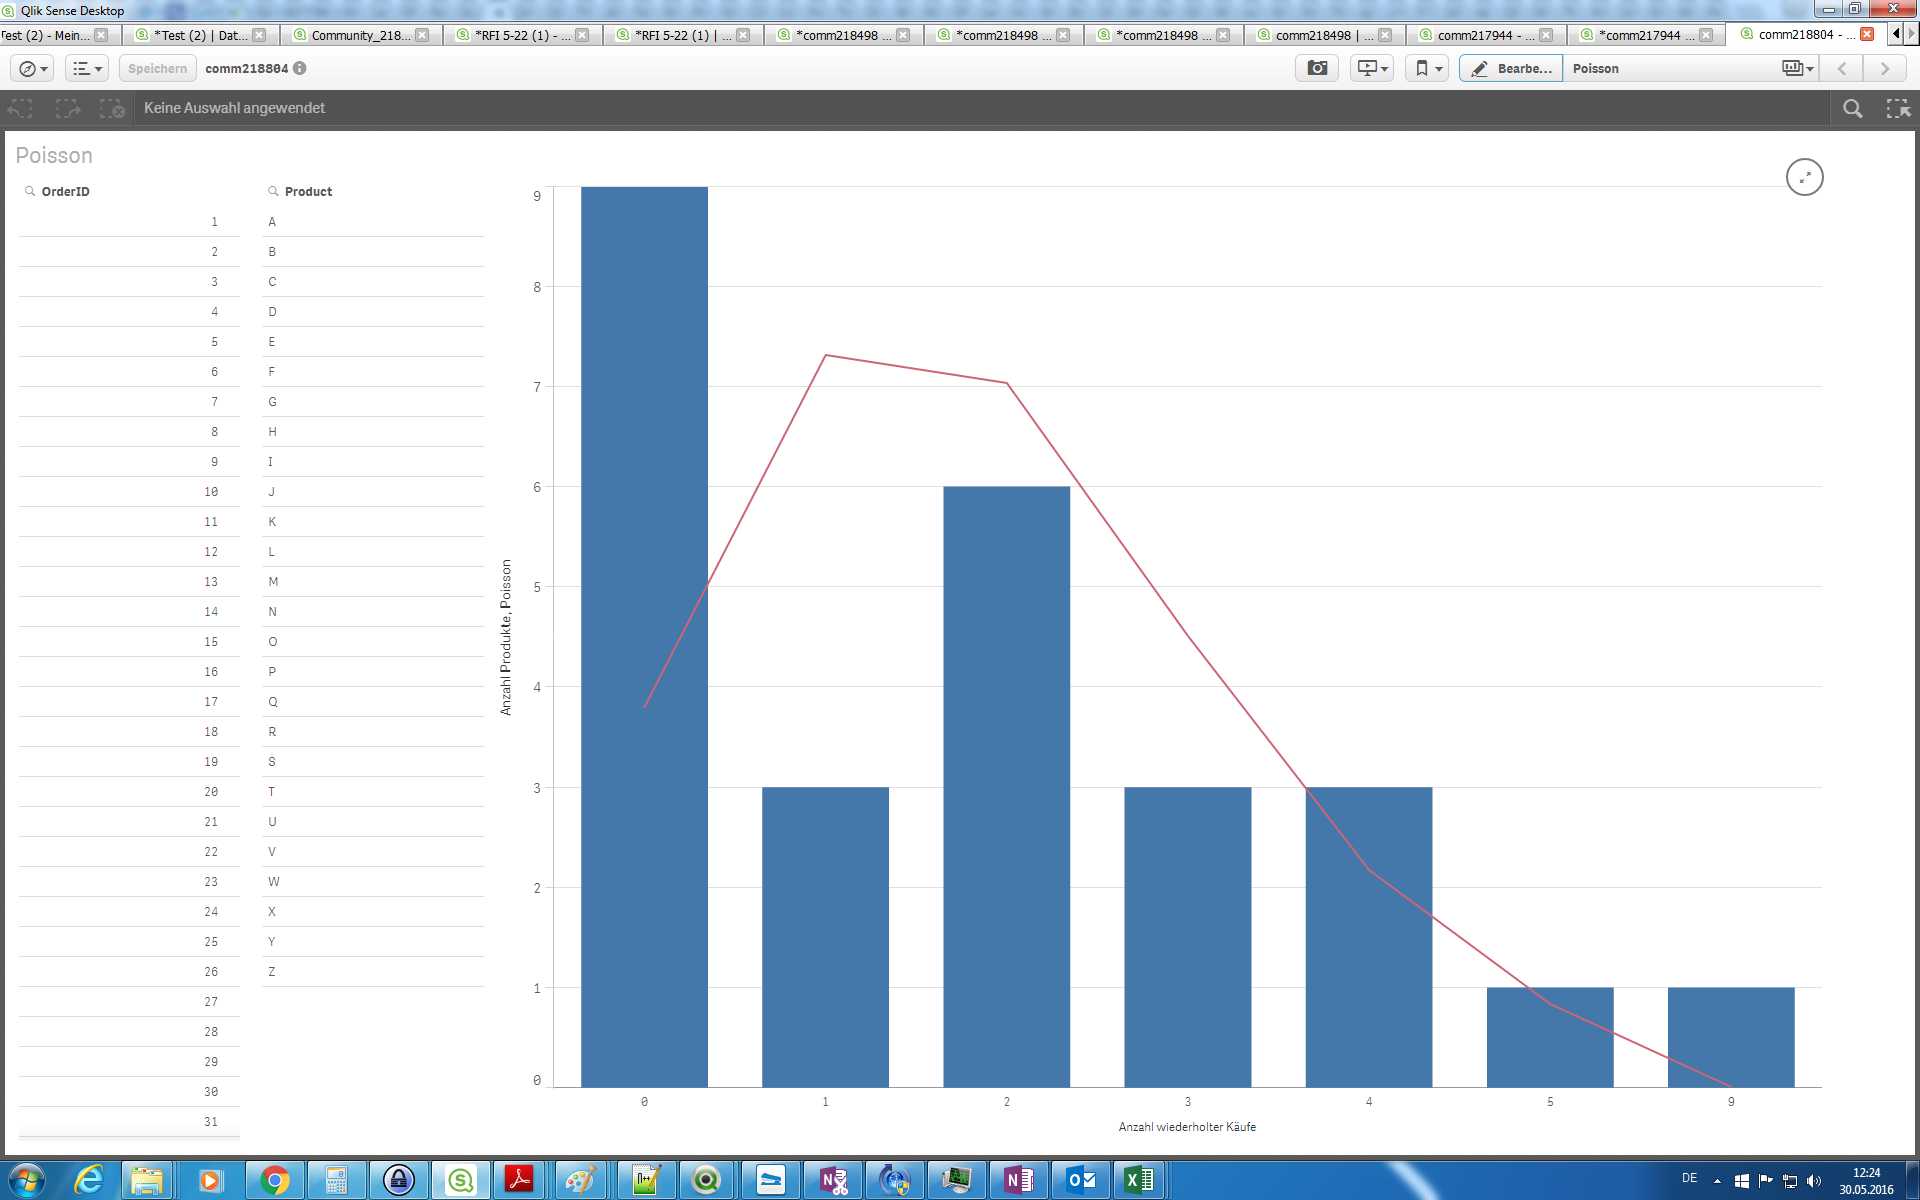
Maybe like attached?
The poisson distribution in the graph would need all buckets (no missing values) to be correct, I couldn't find a quick solution to show all buckets.
- Mark as New
- Bookmark
- Subscribe
- Mute
- Subscribe to RSS Feed
- Permalink
- Report Inappropriate Content
Hello,
many thanks - that looks promising - forgive my newbie question: What is the variable 'l" (lower case L) in Pow(l, ...)?
All the best
- Mark as New
- Bookmark
- Subscribe
- Mute
- Subscribe to RSS Feed
- Permalink
- Report Inappropriate Content
It's basically the lambda parameter, as used e.g. in
- Mark as New
- Bookmark
- Subscribe
- Mute
- Subscribe to RSS Feed
- Permalink
- Report Inappropriate Content
Hello,
ok, thanks - I agree that my question wasn't very specific...
The formula you provided in your example is well defined within your document, however, when I copy it over to mine and change PRODUCT and ORDER_ID to the equivalents in mine, I'm left with the parameter "l".
Ah, I just found it as a variable...
Apologies, I'm fairly new to Sense and I forgot to click there...
All the best
- Mark as New
- Bookmark
- Subscribe
- Mute
- Subscribe to RSS Feed
- Permalink
- Report Inappropriate Content
You're welcome.
I assumed since you called 'l' a variable, you were already referring to a Qlik variable.