Unlock a world of possibilities! Login now and discover the exclusive benefits awaiting you.
- Qlik Community
- :
- All Forums
- :
- QlikView App Dev
- :
- Polarplot 360° without legend numbers
Options
- Subscribe to RSS Feed
- Mark Topic as New
- Mark Topic as Read
- Float this Topic for Current User
- Bookmark
- Subscribe
- Mute
- Printer Friendly Page
Turn on suggestions
Auto-suggest helps you quickly narrow down your search results by suggesting possible matches as you type.
Showing results for
Not applicable
2012-03-19
05:25 AM
- Mark as New
- Bookmark
- Subscribe
- Mute
- Subscribe to RSS Feed
- Permalink
- Report Inappropriate Content
Polarplot 360° without legend numbers
We are plotting a polarplot with frequencies. Where there is one variable for which the frequency of its 360° values is plotted. Unfortunately, all 360 values are plotted around as a legen. But instead of every 1°, we prefer every 30°. How can we do this, any ideas?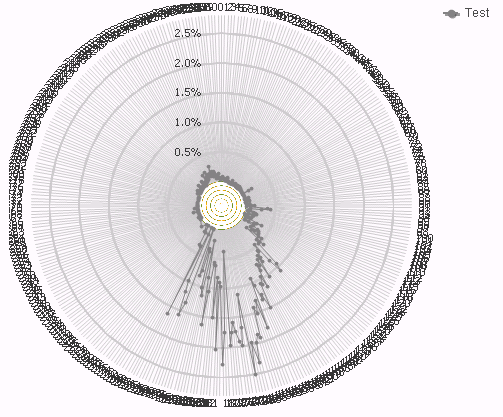
If we chose uncheck "Show Legend", we obtain a figure with no legends at all.
Any help will be apprecciated.
Cheers,
Jonas
284 Views
0 Replies