Unlock a world of possibilities! Login now and discover the exclusive benefits awaiting you.
- Qlik Community
- :
- All Forums
- :
- QlikView App Dev
- :
- Populate data between Start and End dates in line ...
- Subscribe to RSS Feed
- Mark Topic as New
- Mark Topic as Read
- Float this Topic for Current User
- Bookmark
- Subscribe
- Mute
- Printer Friendly Page
- Mark as New
- Bookmark
- Subscribe
- Mute
- Subscribe to RSS Feed
- Permalink
- Report Inappropriate Content
Populate data between Start and End dates in line line chart
I have a programmed activity table where I have a Start and an End date for each activity, each activity have a Volume as other field.
| ActivityID | Start Date | End Date | Volume |
|---|---|---|---|
| 1 | 01/03/2012 | 10/03/2012 | 120 |
| 2 | 05/03/2012 | 20/03/2012 | 245 |
| 3 | 15/03/2012 | 09/04/2012 | 65 |
| 4 | 25/03/2012 | 28/03/2012 | 72 |
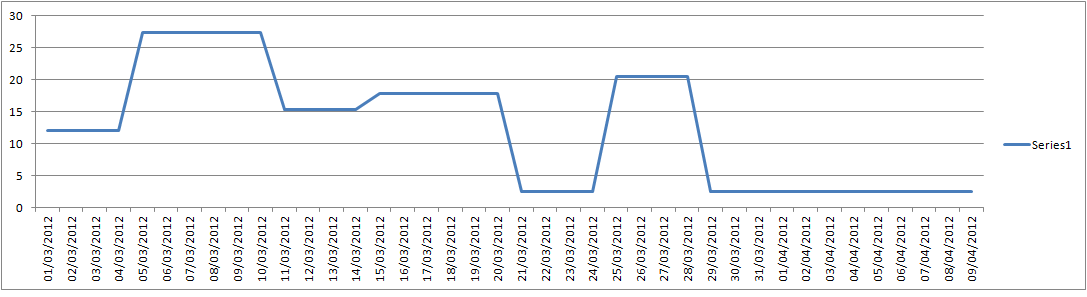
I wuld like to represent in a line chart the total value for each day between the min and max date (01/03/2012 to 09/04/2012). My problem is no the calendar, but to know for example the total value for a specific day. For example, the value for day 07/03/2012 will be 120/10 (10 is the total of days for activity 1) + 245/21 (21 total of days activity 2) wich will give me a total of 27.3125 for that day. As you see, in the original data, I have no data for that specific date.
Example of what I would like to do.
Any help will be very apreciates. Thanks in advance.
Patrick
Accepted Solutions
- Mark as New
- Bookmark
- Subscribe
- Mute
- Subscribe to RSS Feed
- Permalink
- Report Inappropriate Content
Hi Patrick,
You can find attached a solution for your request.
Hope this helps 
- Mark as New
- Bookmark
- Subscribe
- Mute
- Subscribe to RSS Feed
- Permalink
- Report Inappropriate Content
Is my question unclear? or my needs? Any help will be apreciated. Thanks
- Mark as New
- Bookmark
- Subscribe
- Mute
- Subscribe to RSS Feed
- Permalink
- Report Inappropriate Content
Hi Patrick,
You can find attached a solution for your request.
Hope this helps
- Mark as New
- Bookmark
- Subscribe
- Mute
- Subscribe to RSS Feed
- Permalink
- Report Inappropriate Content
JP,
Just want to send you a big thanks, it help me a lot.
Patrick
- Mark as New
- Bookmark
- Subscribe
- Mute
- Subscribe to RSS Feed
- Permalink
- Report Inappropriate Content
JP,
may I abuse of your help?
I put the script in my file and this is what I have:
for i =0 to NoOfRows('TarjetaTrabajoD')-1
let vAct = Peek('ActividadId_TTD', $(i), 'TarjetaTrabajoD');
let vStart = Peek('StartDate_Plan', $(i), 'TarjetaTrabajoD');
let vDays = Peek('NumOfDays_Plan', $(i), 'TarjetaTrabajoD');
let vVol = Peek('Cantidad_Act', $(i), 'TarjetaTrabajoD') / $(vDays);
DataPlaneacion:
LOAD $(vAct) as ActividadId_TTD_Plan,
$(vStart) + RecNo() - 1 as PeriodDate_Plan,
Year($(vStart)) as Year_Plan,
Month($(vStart)) as Month_plan,
$(vVol) as DailyVolume_Plan
AutoGenerate $(vDays);
next
But loading the script it give me this error:
Field not found - <AC015106>
DataPlaneacion:
LOAD AC015106 as ActividadId_TTD_Plan,
41169 + RecNo() - 1 as PeriodDate_Plan,
Year(41169) as Year_Plan,
Month(41169) as Month_plan,
0.083333333333333 as DailyVolume_Plan
AutoGenerate 12
Can you explain me what is this error and how to resolve it.
- Mark as New
- Bookmark
- Subscribe
- Mute
- Subscribe to RSS Feed
- Permalink
- Report Inappropriate Content
Literal string values need to be enclosed in quotes. Try: 'ACO15106' as ActividadId_TTD_Plan
talk is cheap, supply exceeds demand
- Mark as New
- Bookmark
- Subscribe
- Mute
- Subscribe to RSS Feed
- Permalink
- Report Inappropriate Content
Thanks a lot, I didn't think about it.....
- Mark as New
- Bookmark
- Subscribe
- Mute
- Subscribe to RSS Feed
- Permalink
- Report Inappropriate Content
Hello Patrick,
Great to hear that the solution did the job and be assured that there is no abuse at all.
Sorry for the late reply but it was a long day at work, glad to see that gwassenaar helped you on your request.
Cheers!

- Mark as New
- Bookmark
- Subscribe
- Mute
- Subscribe to RSS Feed
- Permalink
- Report Inappropriate Content
Hello,
This is a great solution to my problem. Is there anyway to make the chart display a monthly x axis? I got it working but instead of starting at StartDate the x axis starts at 12/31/1899. Any help would be greatly appreciated.
Thanks,
Zach