Unlock a world of possibilities! Login now and discover the exclusive benefits awaiting you.
- Qlik Community
- :
- All Forums
- :
- QlikView App Dev
- :
- Relative pct. in pivottabel
- Subscribe to RSS Feed
- Mark Topic as New
- Mark Topic as Read
- Float this Topic for Current User
- Bookmark
- Subscribe
- Mute
- Printer Friendly Page
- Mark as New
- Bookmark
- Subscribe
- Mute
- Subscribe to RSS Feed
- Permalink
- Report Inappropriate Content
Relative pct. in pivottabel
Hi,
I need to know how I can create the following solution in Qlikview.
I have alot of data, therefor I have alot of pivot tabels to simplify the data.
However, I need to add the relative pct. to the tabel - so far without luck.
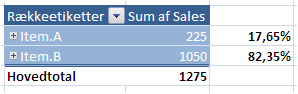
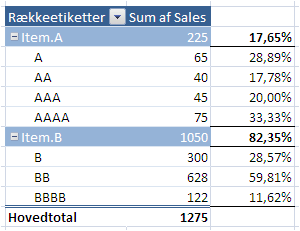
How can I get my qlikview pivottabel to act as the Excel screenshots below;
Thanks in advance to all of you 
/Martin
- « Previous Replies
-
- 1
- 2
- Next Replies »
- Mark as New
- Bookmark
- Subscribe
- Mute
- Subscribe to RSS Feed
- Permalink
- Report Inappropriate Content
Yes you can make charts like attached snap they are pivot tables use pivot charts for this.
Hope this helps
- Mark as New
- Bookmark
- Subscribe
- Mute
- Subscribe to RSS Feed
- Permalink
- Report Inappropriate Content
The best way to calculate relative percentages is to use the "total" qualifier. Hence, in your case, you should have two expressions:
Sum(Sales)
Sum(Sales) / Sum(total Sales)
HIC
- Mark as New
- Bookmark
- Subscribe
- Mute
- Subscribe to RSS Feed
- Permalink
- Report Inappropriate Content
I know how to make pivot tabels in Qlikview - that was not the question.
The questions was as to how I can make the percentage calculation as shown in the Pictures.
/Martin
- Mark as New
- Bookmark
- Subscribe
- Mute
- Subscribe to RSS Feed
- Permalink
- Report Inappropriate Content
Hi Henric,
Thanks for the reply - however, I don't want to create to expressions as my table already have plenty of expression.
Any other suggstions?
/Martin
- Mark as New
- Bookmark
- Subscribe
- Mute
- Subscribe to RSS Feed
- Permalink
- Report Inappropriate Content
Then you just use the expressions you want. For the relative number, you should use
Sum(Sales) / Sum(total Sales)
HIC
- Mark as New
- Bookmark
- Subscribe
- Mute
- Subscribe to RSS Feed
- Permalink
- Report Inappropriate Content
I your Sum(Sales) or Sum(total Sales) are callculated in other expressions of the same chart, You may use thems results in another expression (almost like in xls) . U may call it by name (label).
regards
Darek
- Mark as New
- Bookmark
- Subscribe
- Mute
- Subscribe to RSS Feed
- Permalink
- Report Inappropriate Content
Hi Again,
Neither of your espressions gives me the result that I wanted.
/Martin
- Mark as New
- Bookmark
- Subscribe
- Mute
- Subscribe to RSS Feed
- Permalink
- Report Inappropriate Content
Your suggestions is very simliar to that of Henric - and therefor this doesn't provide the desired result.
/Martin
- Mark as New
- Bookmark
- Subscribe
- Mute
- Subscribe to RSS Feed
- Permalink
- Report Inappropriate Content
Some types of charts have "Relative" option. But pivot has not.
I think it is not possible to show values if it has not expression. You most often need also dimension (s) .
Sometimes it may be useful to add artificial dimension to have less expressions. But i don't understand what is the problem of having 1 more epression in your chart?
regards
Darek
- « Previous Replies
-
- 1
- 2
- Next Replies »