Unlock a world of possibilities! Login now and discover the exclusive benefits awaiting you.
- Qlik Community
- :
- All Forums
- :
- QlikView App Dev
- :
- Replicating Scatter Graph from Excel (Boston Consu...
- Subscribe to RSS Feed
- Mark Topic as New
- Mark Topic as Read
- Float this Topic for Current User
- Bookmark
- Subscribe
- Mute
- Printer Friendly Page
- Mark as New
- Bookmark
- Subscribe
- Mute
- Subscribe to RSS Feed
- Permalink
- Report Inappropriate Content
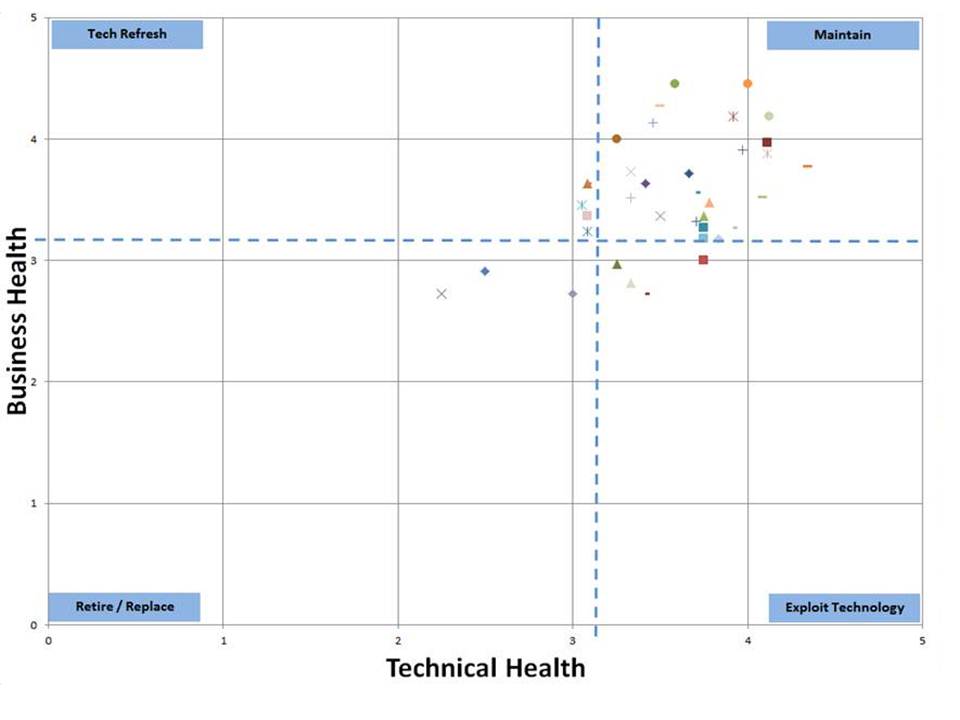
Replicating Scatter Graph from Excel (Boston Consulting Group (BCG) Matrix)
Can anyone help?
I am trying to replicate the following graph that I produced in excel. The data behind the graph scores applications for business health and technical health based on averaging the scores againest a set of criteria. The criteria are categorised as either business or health related. Therefore I calculate the average business score and average techncial an plot a point on the grid for each application. Excel is difficult to use but I can get to a single view as shown below. What I cant do easily in excel is create an interactive map that enables me to show just the applications belonging to a particular group.
These graphs are sometimes referred to as a Boston Consulting Group (BCG) Matrix, or Boston Consulting Grid.