Unlock a world of possibilities! Login now and discover the exclusive benefits awaiting you.
- Qlik Community
- :
- All Forums
- :
- QlikView App Dev
- :
- Re: Rolling 12 Months Chart
- Subscribe to RSS Feed
- Mark Topic as New
- Mark Topic as Read
- Float this Topic for Current User
- Bookmark
- Subscribe
- Mute
- Printer Friendly Page
- Mark as New
- Bookmark
- Subscribe
- Mute
- Subscribe to RSS Feed
- Permalink
- Report Inappropriate Content
Rolling 12 Months Chart
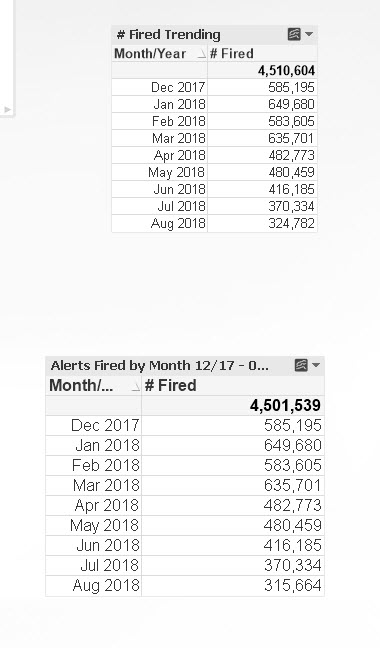
I have two charts that should show the same numbers since I have less than 12 months of data but for some reason, I am getting a lower number in my last month when using:
count({1<TRX_DATE={">=$(=addmonths(monthend(max(TRX_DATE))+1,-12)) <=$(=max(TRX_DATE))"}>}distinct FIRING_RECORD)
Than when just using
count(distinct FIRING_RECORD)
My current data set is from 12/1/2017 - 8/26/2018. How do I ensure that both graphs show the same number in the month of August?
- Mark as New
- Bookmark
- Subscribe
- Mute
- Subscribe to RSS Feed
- Permalink
- Report Inappropriate Content
Is TRX_DATE a timestamp field may be?
- Mark as New
- Bookmark
- Subscribe
- Mute
- Subscribe to RSS Feed
- Permalink
- Report Inappropriate Content
It might but in the load script I have: date(TRX_DATE, 'MM/DD/YYYY') as TRX_DATE
- Mark as New
- Bookmark
- Subscribe
- Mute
- Subscribe to RSS Feed
- Permalink
- Report Inappropriate Content
Date is just a formatting function... try this
date(Floor(TRX_DATE), 'MM/DD/YYYY') as TRX_DATE
- Mark as New
- Bookmark
- Subscribe
- Mute
- Subscribe to RSS Feed
- Permalink
- Report Inappropriate Content
Do you have any idea how I can turn email notifications of posts on my threads? Somehow it got turned off.
- Mark as New
- Bookmark
- Subscribe
- Mute
- Subscribe to RSS Feed
- Permalink
- Report Inappropriate Content
Not entirely sure, but may be you have to follow the thread
- Mark as New
- Bookmark
- Subscribe
- Mute
- Subscribe to RSS Feed
- Permalink
- Report Inappropriate Content
That did not fix it.
- Mark as New
- Bookmark
- Subscribe
- Mute
- Subscribe to RSS Feed
- Permalink
- Report Inappropriate Content
count(DISTINCT FIRING_RECORD) vs count({1<TRX_DATE={">=$(=addmonths(monthend(max(TRX_DATE))+1,-12)) <=$(=max(TRX_DATE))"}>}distinct FIRING_RECORD)
- Mark as New
- Bookmark
- Subscribe
- Mute
- Subscribe to RSS Feed
- Permalink
- Report Inappropriate Content
Hi would suggest to investigate last month dates.
Try to add TRX_DATE as dimension in straight table as well as two expressions. Then add max(TRX_DATE) somewhere in text box in order to look at this value.
Probably it will give you idea where issue is.