Unlock a world of possibilities! Login now and discover the exclusive benefits awaiting you.
- Qlik Community
- :
- All Forums
- :
- QlikView App Dev
- :
- Rolling worse Minimum average
- Subscribe to RSS Feed
- Mark Topic as New
- Mark Topic as Read
- Float this Topic for Current User
- Bookmark
- Subscribe
- Mute
- Printer Friendly Page
- Mark as New
- Bookmark
- Subscribe
- Mute
- Subscribe to RSS Feed
- Permalink
- Report Inappropriate Content
Rolling worse Minimum average
I have a tricky problem which is quite easy in Excel but I am struggling to find a solution within QlikView.
I have a list of dates and Values for which on a line by line basis I need to calculate the average of the minimum 33 values below that line. When that total changes show that diff. For my final table I only need to show the lines where there is a diff.
I have mocked up a spreadsheet (attached) which has two different methodologies. One uses an average of Small(column F) and one uses a sumIF (column E) used in conjunction with column D.
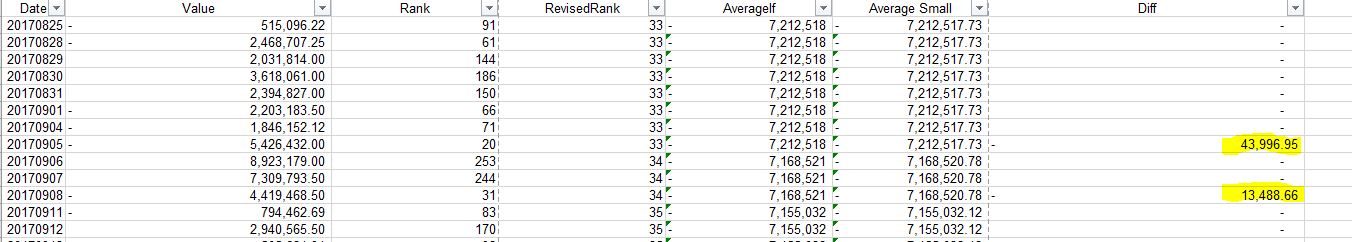
I almost get the answer using the below expression but the issue with that is once you go past the first rank <33 technically you should be then looking for the worse 34 ranks and so on.
rangeavg(Below(Avg({<Rank={"<=33"}>}[Value]),0,300))
I have explored using this formula to use the [RevisesRank] as part of the calculation or combinations of aggr but can't get either to work.
Any incite that can be provided would be appreciated.
Thanks, Ross
- Mark as New
- Bookmark
- Subscribe
- Mute
- Subscribe to RSS Feed
- Permalink
- Report Inappropriate Content
I was just thinking about the problem from a SQL perspective and this is the SQL solution I would use:
SELECT A.Date, A.Value, A.Rank, A.RevisedRank, (SELECT Avg(Value) AS AvgOfValue FROM Test B WHERE B.Rank<=A.RevisedRank AND B.Date>= A.Date) As RollingAve
FROM Test AS A;
- Mark as New
- Bookmark
- Subscribe
- Mute
- Subscribe to RSS Feed
- Permalink
- Report Inappropriate Content
I didn't find a more elegant solution so I went back to my SQL days...
As there will only every be 260 rows I loop through each row of the data create a temp table with the below 33 minimum value and then take an average of those 33 records. This is then aggregated into another table.