Unlock a world of possibilities! Login now and discover the exclusive benefits awaiting you.
- Qlik Community
- :
- All Forums
- :
- QlikView App Dev
- :
- Re: Same information different charts
- Subscribe to RSS Feed
- Mark Topic as New
- Mark Topic as Read
- Float this Topic for Current User
- Bookmark
- Subscribe
- Mute
- Printer Friendly Page
- Mark as New
- Bookmark
- Subscribe
- Mute
- Subscribe to RSS Feed
- Permalink
- Report Inappropriate Content
Same information different charts
Good day
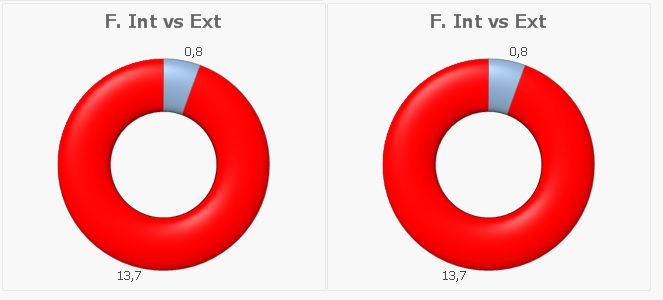
I have a question, i am building my application using several Excel spreadsheet that contain exactly the same fields. What i am trying to achieve is the following, the chart on the left must shown total information of all entities and the chart on the right should have only the information of one entitiy.
Obviuosly as you can see both have the same info everytime i select something.
Please help
Thanks in advance
- Mark as New
- Bookmark
- Subscribe
- Mute
- Subscribe to RSS Feed
- Permalink
- Report Inappropriate Content
If I understood correctly, create a field when loading your Excel files that identify your source:
LOAD
'A' as SOURCE,
FieldA,
FieldB,
...
FROM YourExcelFile_A.xls;
LOAD
'B' as SOURCE,
FieldA,
FieldB,
...
FROM YourExcelFile_B.xls;
...
[Just a demo, you don't need to explicite repeat the LOAD statements, if you can make the Source definition dynamic, e.g. by parsing FileName() ]
Then use a filter in your second chart to limit the records to one source (e.g. B), like
Sum({<SOURCE= {'B'}>} FieldA)
Sum({<SOURCE= {'B'}>} FieldB)