Unlock a world of possibilities! Login now and discover the exclusive benefits awaiting you.
- Qlik Community
- :
- All Forums
- :
- QlikView App Dev
- :
- Scatter Chart - Display colors between selected an...
- Subscribe to RSS Feed
- Mark Topic as New
- Mark Topic as Read
- Float this Topic for Current User
- Bookmark
- Subscribe
- Mute
- Printer Friendly Page
- Mark as New
- Bookmark
- Subscribe
- Mute
- Subscribe to RSS Feed
- Permalink
- Report Inappropriate Content
Scatter Chart - Display colors between selected and non selected
Hello community,
I have a Scatter Chart that has two expressions calculated - random rates; and a Company Id as Dimension.
My need is to show all Company Id's as green, although the selected company Id's have to be Gray. How can I highlight the selected ID's from the thousands of green points in the chart?
Also is it possible to set Transparency to 10%, in the following RGB(252,252,252), considering that I am defining this color in Background Color.
Thanks in advance for your support.
Best Regards,
Sérgio Duarte
- Mark as New
- Bookmark
- Subscribe
- Mute
- Subscribe to RSS Feed
- Permalink
- Report Inappropriate Content
I feel it might be possible, but this needs to be tested out. Do you have a sample we can take a look at?
- Mark as New
- Bookmark
- Subscribe
- Mute
- Subscribe to RSS Feed
- Permalink
- Report Inappropriate Content
Hi,
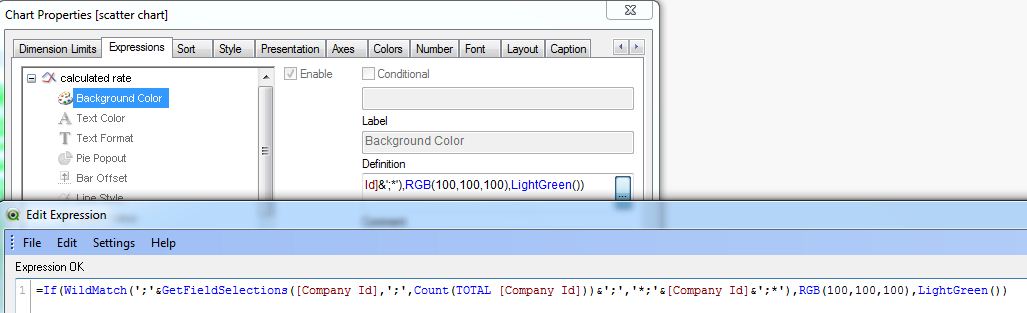
one solution could be:
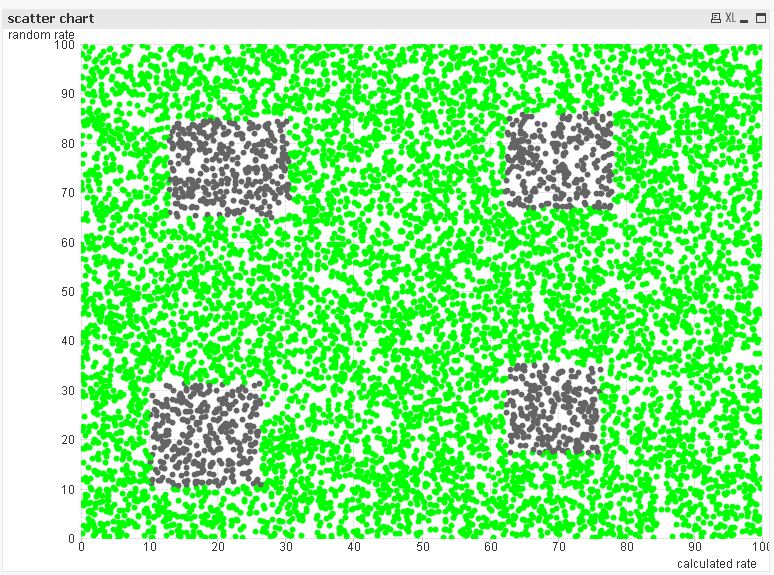
although I think, showing the selected IDs as green and excluded as gray is more intuitive in QlikView:
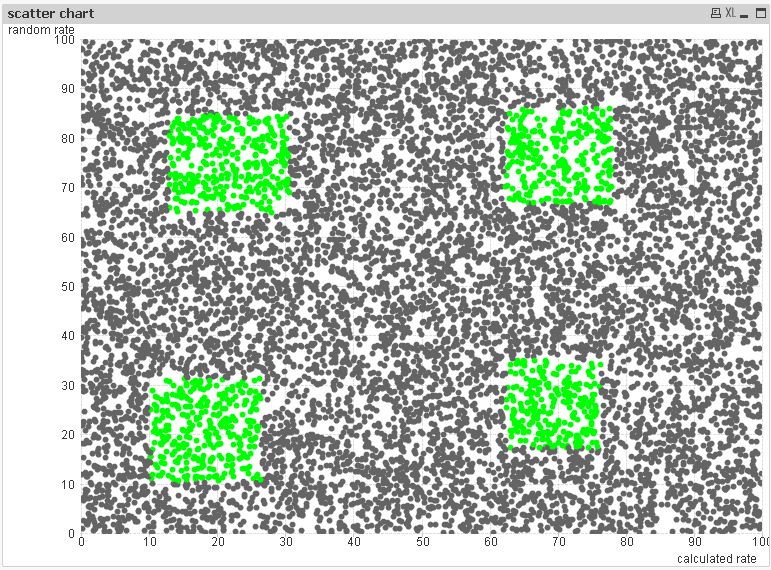
hope this helps
regards
Marco