Unlock a world of possibilities! Login now and discover the exclusive benefits awaiting you.
- Qlik Community
- :
- All Forums
- :
- QlikView App Dev
- :
- Scatter chart - disabling drilldown to base level
- Subscribe to RSS Feed
- Mark Topic as New
- Mark Topic as Read
- Float this Topic for Current User
- Bookmark
- Subscribe
- Mute
- Printer Friendly Page
- Mark as New
- Bookmark
- Subscribe
- Mute
- Subscribe to RSS Feed
- Permalink
- Report Inappropriate Content
Scatter chart - disabling drilldown to base level
Hi all,
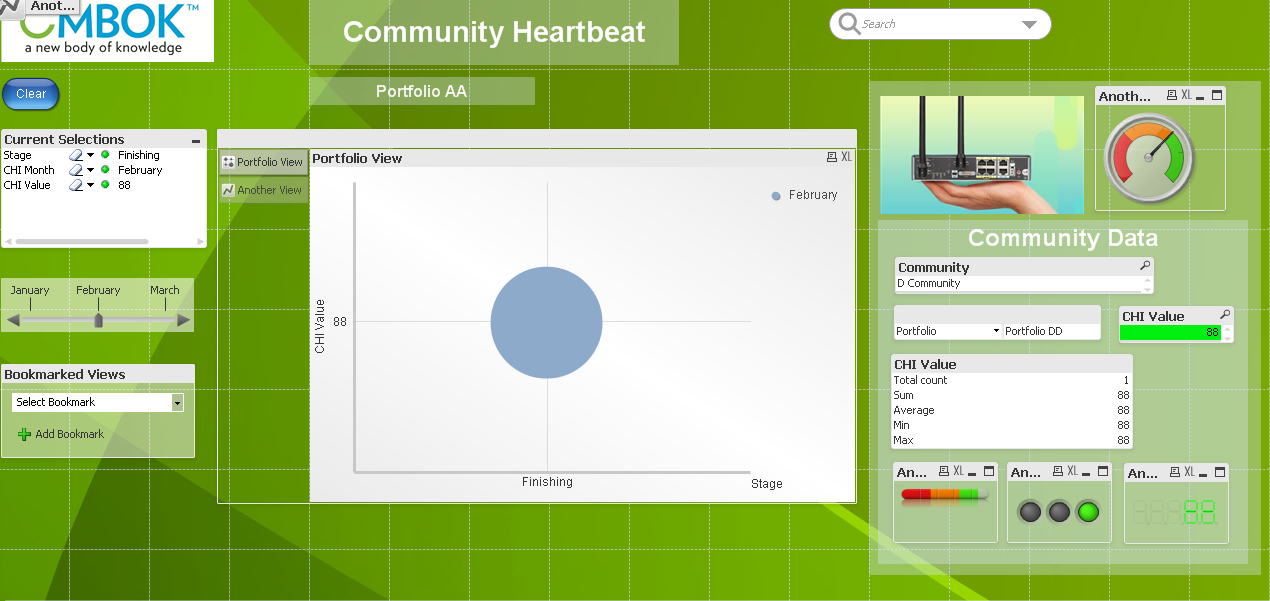
a newbie here so go easy on me! As per the image attached I am developing an app which features a central scatter chart.
My question is...
How can i setup the page so that when the user clicks on an individual data point the scatter chart doesn't update to show a chart with only one big data point but instead updates the panel to the right (highlighted in yellow) with data from the individual data point (the kind of info highlighted on the hover-over)
The app is for an ipod so adding more fields to the hover-over box won't work.
Any thoughts???
Thanks in advance
Chris
- Mark as New
- Bookmark
- Subscribe
- Mute
- Subscribe to RSS Feed
- Permalink
- Report Inappropriate Content
To help you understand my ramblings above.... this is the scatter chart screen that i want to avoid...
- Mark as New
- Bookmark
- Subscribe
- Mute
- Subscribe to RSS Feed
- Permalink
- Report Inappropriate Content
Hi Chris,
Update your expressions for X, Y axis and Bubble size with set analysis on month to ingore month selection.
Something like this:
Old: sum(Sales)
New: sum({<Month_Name=>} Sales)
Regards,
Kiran.